Complex Visualization
The Wolfram Language includes built-in support for visualizing complex-valued data and functions easily and directly. Gain insights that are difficult to obtain when plotting just the real values of functions. Quickly identify zeros, poles and other features of complex functions using visual aids such as color shading and geometric objects.
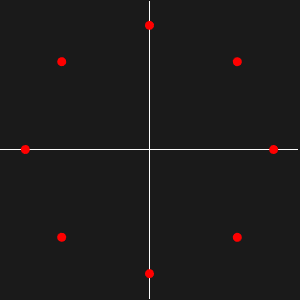
- Plot numbers on the complex plane. »
- Label the coordinates in the complex plane in either Cartesian or polar forms.
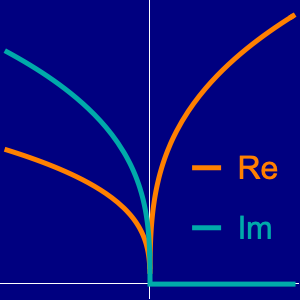
- Plot the real and imaginary components of a function over the real numbers. »
- Customize the styling and labeling of the real and imaginary parts.
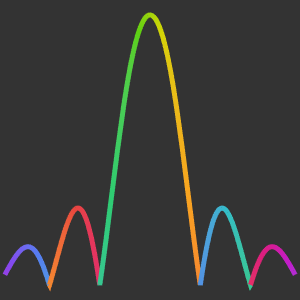
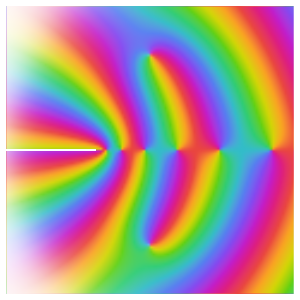
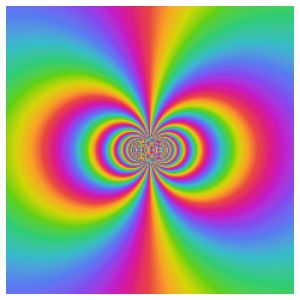
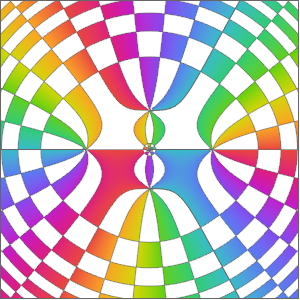
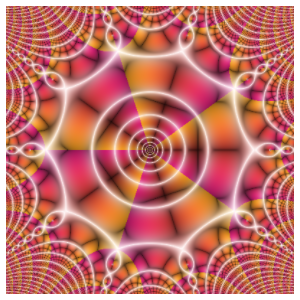
- Implement domain coloring for a complex function. »
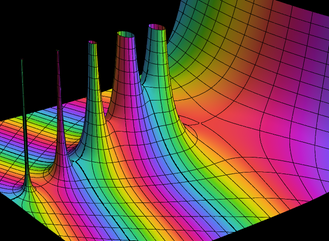
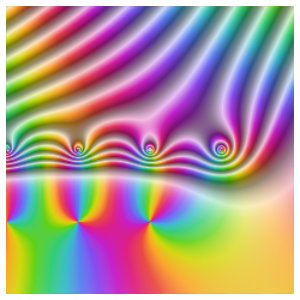
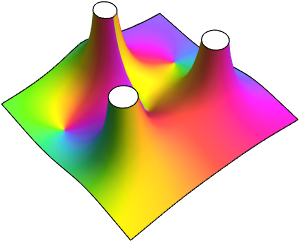
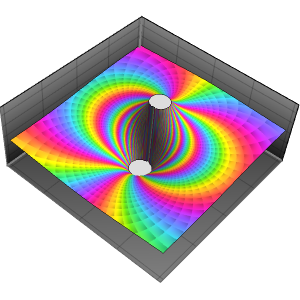
- Use height and color to show the magnitude and phase of complex functions over the reals and complexes. »
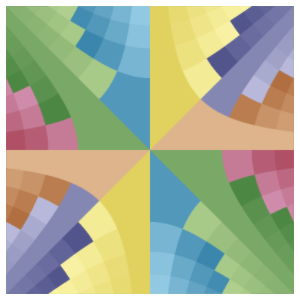
- Use a variety of coloring schemes to emphasize features of complex functions. »
Related Examples