


Visualization & Graphics
Visualization: Labels, Scales, Exclusions »
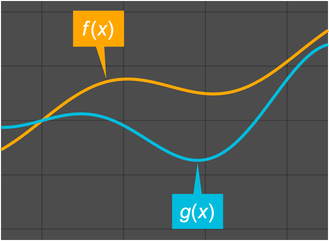
Mathematica Version 11 energizes the core visualization functions by adding powerful features that make plots easier to read and use. It is now easy to add labels to individual points or entire datasets, using positions that are automatically computed or explicitly given. Callouts extend this with a rich language for controlling the appearance of the label, leader lines, and overall appearance. Use logarithmic scaling functions to make it easier to view plots that span wide ranges of values, or reverse the axes to turn a plot on its head. The exclusions engine has been extended to detect and remove artifacts around singularities, including poles and essential singularities, for a wider set of functions.
New Visualization Domains »
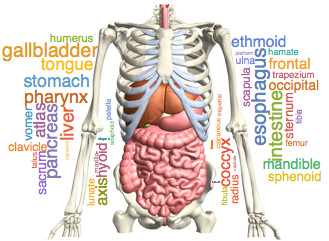
From anatomy to audio to automata, Mathematica Version 11 adds specialized visualization functions for a wide range of topics. Date and time visualization has been expanded to include timelines for showing what happened when and histograms for seeing the frequency of events. The distribution of geographic locations can also be visualized as histograms, and there are interactive maps that can be panned and zoomed. New functions for language and text visualization make it easy to visualize themes using word clouds and to see the grammatical structure of sentences.
Volume Visualization »
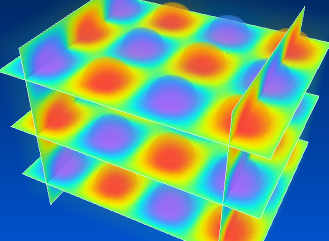
Version 11 of the Wolfram Language, which Mathematica is based on, adds new classes of functions for 4D visualization. Density plots combine colors and opacity to represent the values of formulas and vectors over a 3D region. Slice plots show contours, densities, and vector fields on surfaces passing through a volume. The slice surfaces are quite flexible, supporting any combination of built-in planes, equations, and arbitrary regions.