5061

Visualization: Labels, Scales, Exclusions

Visualization: Labels, Scales, Exclusions in Mathematica 11

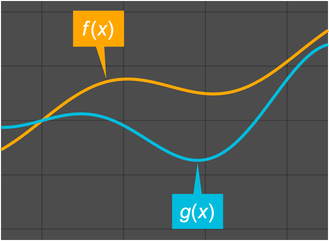
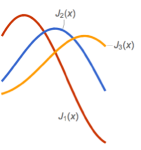
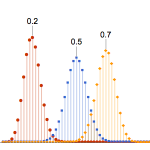
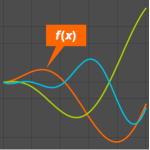
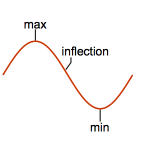
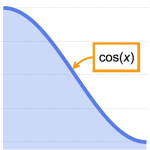
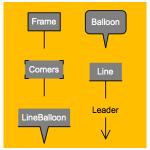
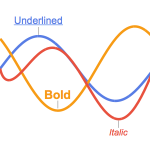
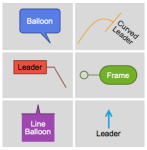
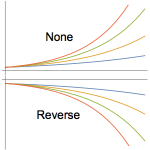
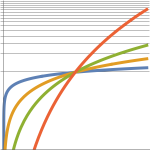
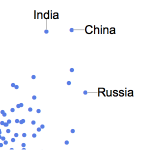
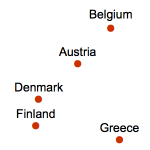
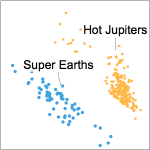
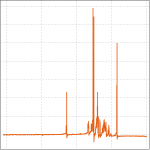
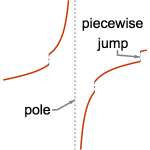
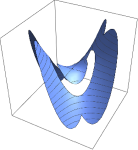
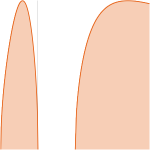
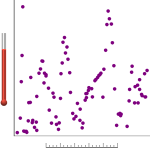
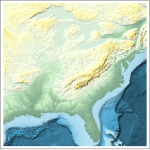
Mathematica Version 11 energizes the core visualization functions by adding powerful features that make plots easier to read and use. It is now easy to add labels to individual points or entire datasets, using positions that are automatically computed or explicitly given. Callouts extend this with a rich language for controlling the appearance of the label, leader lines, and overall appearance. Use logarithmic scaling functions to make it easier to view plots that span wide ranges of values, or reverse the axes to turn a plot on its head. The exclusions engine has been extended to detect and remove artifacts around singularities, including poles and essential singularities, for a wider set of functions.

Key Features

  • Expanded support for labeling points and curves. »
  • Labels can be automatically positioned.
  • Use data to automatically generate labels for points. »
  • New functionality for adding callouts to points and curves. »
  • Control the appearance of callout elements, such as text, leader lines, and balloons.
  • Associate labels with data with flexible structures.
  • Scale axes with built-in and custom scaling functions. »
  • Updated exclusions engine detects more singularities, including poles and essential singularities. »

Related Examples


New Labeling System »

Place Labels Relative to Data »

Specify Label Locations »

Multiple Callouts »

Leader Lines in Callouts »

Styling Callouts »

Controlling Callout Labels »

Callout Gallery »

Auto-labeling Data »

Programmatically Labeling Points »

Use Anything as a Label »

Meteor Shower Data »

Named ScalingFunctions »

Population Growth »

Scale Any Axes »

Define a Scaling Function »

Population vs. Area »

Point-Feature Labeling System »

Exoplanets »

Nuclear Magnetic Resonance »

Detect and Remove Singular Points »

Identify Types of Singularities and Discontinuities »

Detect and Remove Singular Curves »

Automatic Exclusions »

Plot over Regions »

Plot a Function over Its Domain »

Plot Temperature vs. Size »

Plot Elevations with Units »