Core Visualization
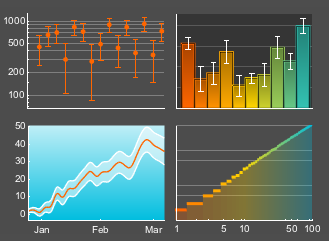
Version 12 extends the functionality of existing visualizations to make it easier to extract information from plots and charts. Visualize extreme ranges with new scaling function support for more types of plots. See the full range of uncertain values in data with flexible error bars, bands and regions. View your data in new ways with new layouts for plots that juxtapose datasets in ways that make it easy to compare values and trends.
- Apply arbitrary scaling functions to any dimension in contour, density, surface and discrete plots. »
- Plots automatically adjust their settings based on the scaling functions.
- Use stacked and percentile plot layouts to see how sets of data relate to the whole. »
- Create grids of plots with shared axes to make individual components easier to read. »


