Visualization & Graphics
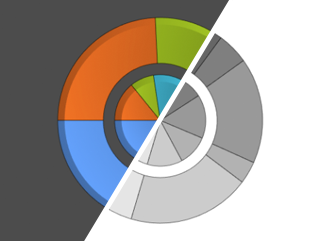
Plot Themes »
Mathematica Version 10 introduces plot themes to easily tailor plots for specific audiences, from business reports to technical articles. The built-in base themes provide a unified appearance and tone across visualization functions, and are easily tweaked using additional themes and options. Themes can be applied to a specific plot, a localized group of plots, or across the board. |
|
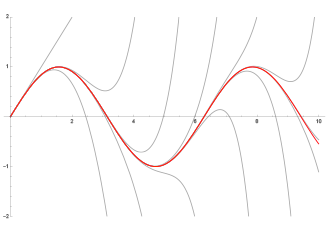
Enhanced Visualization »
Mathematica Version 10 refreshes the overall aesthetic for visualizations, combining a bolder, unified color scheme across all visualization functions, with new automatic computation of visual attributes such as point sizes, edge styles, surface colors, and axes positioning. Besides the default appearance, a whole set of themes easily and automatically changes how plots look for a variety of situations and uses. The visualization functions are also extended to automatically work on time series, associated arrays, and data with units. |
|
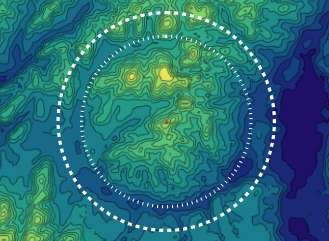
Geographic Visualization »
The Wolfram Language introduces GeoGraphics, an extension of its powerful graphical functionality to produce maps. GeoGraphics offers full automation and freedom to handle cartographic projections, choice of zoom (from the whole Earth down to meter scale), map styling (street maps, relief maps, ...), and much more. GeoGraphics introduces new geographical elements adapted to the surface of the Earth (like geodesics or rhumb lines for navigation) and has integrated access to the large corpus of geographical information in Wolfram|Alpha through the new Entity framework. |
|