New Visualization Domains
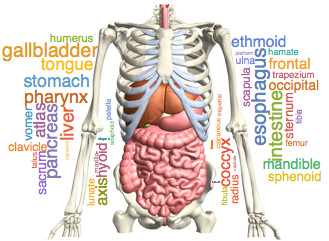
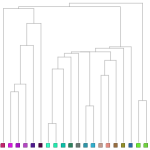
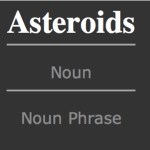
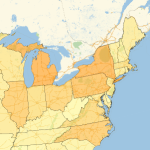
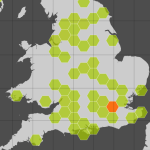
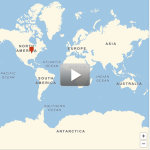
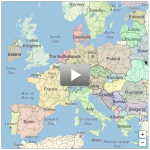
From anatomy to audio to automata, Mathematica Version 11 adds specialized visualization functions for a wide range of topics. Date and time visualization has been expanded to include timelines for showing what happened when and histograms for seeing the frequency of events. The distribution of geographic locations can also be visualized as histograms, and there are interactive maps that can be panned and zoomed. New functions for language and text visualization make it easy to visualize themes using word clouds and to see the grammatical structure of sentences.
Key Features
|
|


