Volume Visualization
Version 11 of the Wolfram Language, which Mathematica is based on, adds new classes of functions for 4D visualization. Density plots combine colors and opacity to represent the values of formulas and vectors over a 3D region. Slice plots show contours, densities, and vector fields on surfaces passing through a volume. The slice surfaces are quite flexible, supporting any combination of built-in planes, equations, and arbitrary regions.
Key Features
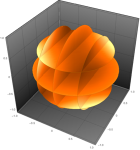
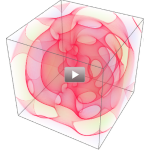
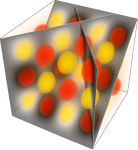
- Create 3D density plots from functions or data.
»
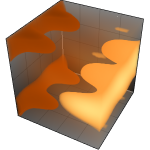
- Plot functions over irregular volumetric domains.
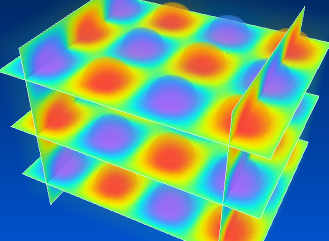
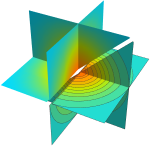
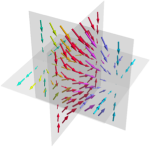
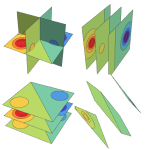
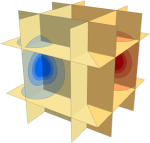
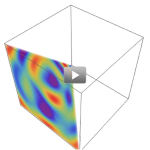
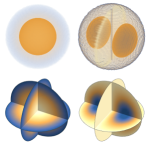
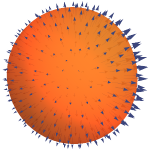
- Draw contours, densities, and vector fields along slices through a 3D space
»
- Use built-in slices for simplicity.
|
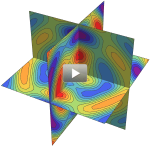
- Generate slices from equations or parametric or implicit regions for more flexibility.
- Provide arbitrary regions for the most control over slices.
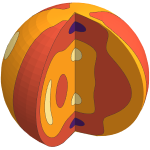
- Clip regions to see interior structures. »
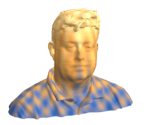
- Simple themes make it easy to create 3D-printable objects from plots.
»
|
Related Examples