5034

Enhanced Geo Visualization

Enhanced Geo Visualization in Mathematica 11

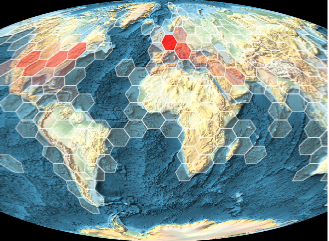
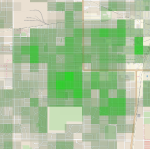
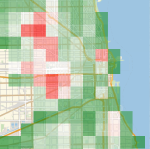
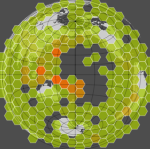
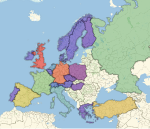
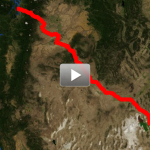
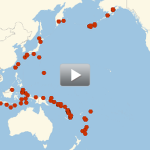
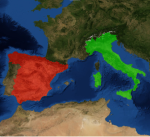
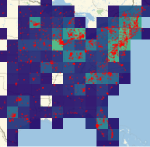
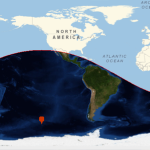
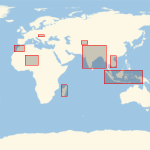
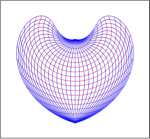
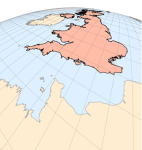
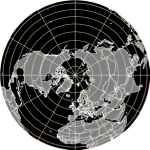
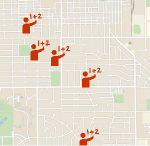
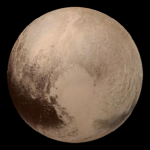
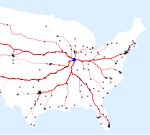
Mathematica Version 11 brings even more flexibility and power to geographic visualization. The new outlines of continents and countries, satellite imagery, and support for independent sources of geo tiles make it easy to create custom appearances for maps. More than a hundred new projections have been added to the system, highlighting specialized features and preserving geometric properties. New primitives make it easy to draw common geographic regions. View the distribution of geographic locations by grouping them into larger regions. Easily adjust maps by changing the background or projection, or even combine multiple maps. Interactive maps allow panning and zooming to see the big picture or fine details.

Key Features

  • See more detail on maps by interactively zooming into the map. »
  • View the distribution of geo locations by grouping them into color-coded regions. »
  • More than 100 new cartographic projections of different aspects, types, and geometric properties. »
  • Combine multiple maps into a new map, re-estimating geo ranges, projection, zoom, etc. if needed.
  • Programmatically change map properties such as projections, backgrounds, zoom, ranges, etc.
  • New geo primitives for representing hemispheres and bounding boxes for geo regions. »
  • New outline style "CountryBorders" for map backgrounds, including access to historical country borders data. »

Related Examples


Measure the Density of Trees »

Demographic Information »

View the Distribution of Earthquakes »

Create Histograms from Weighted Locations »

Explore a Trip »

Zoom in on Earthquakes »

Merge and Modify Maps »

Combine Multiple Types of Maps »

Geo Hemispheres »

Which Country Has This Bounding Box? »

Projected Grid of Latitude and Longitude Lines »

Visualization with a Tilted Perspective Projection »

Country Borders »

Place Icons on Maps »

Pluto »

Drive to Champaign »