Geographic Visualization
The Wolfram Language expands the ability to turn geographic data into stunning maps with new classes of geo visualizations. The new visualization functions provide additional insights, whether you are bringing your own data, using data sources directly available in the Wolfram Language or a mix of both. From simple sets of geo locations to locations with associated values, to complete vector fields, the Wolfram Language makes it easy to style and customize maps to emphasize and highlight the most important features in the data.
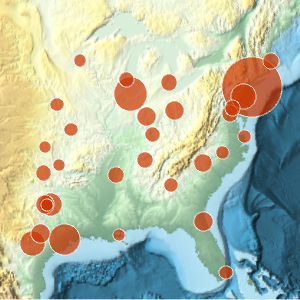
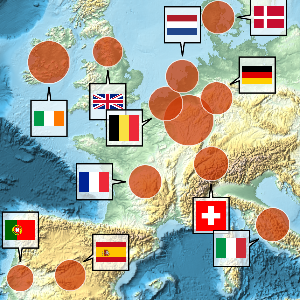
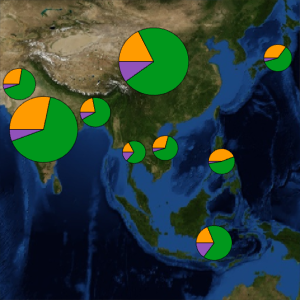
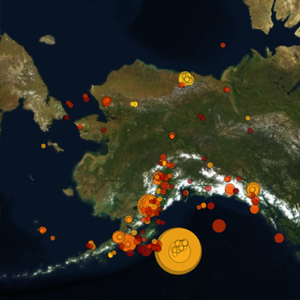
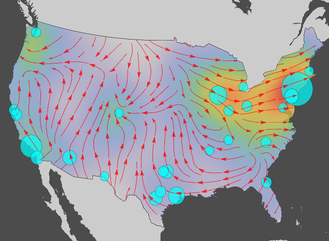
- Display values on a map as bubbles scaled according to the values. »
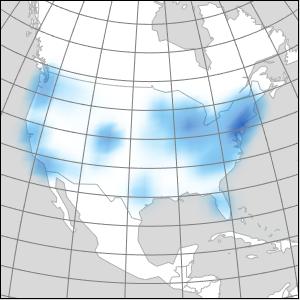
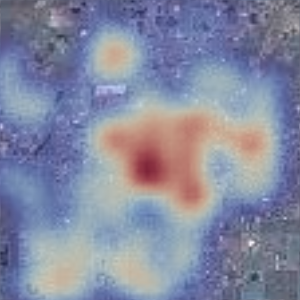
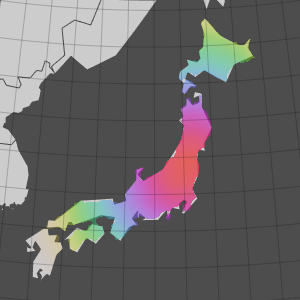
- Show the distribution of points using smoothly varying color densities. »
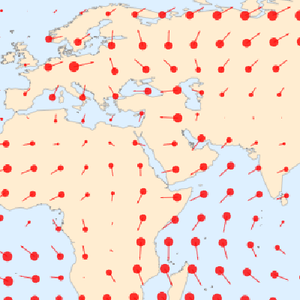
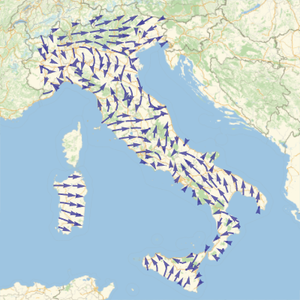
- Plot vector fields on the Earth as either discrete vectors. »
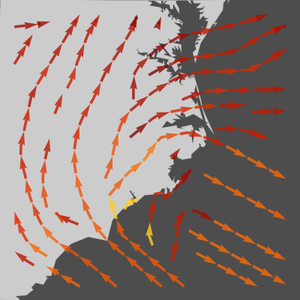
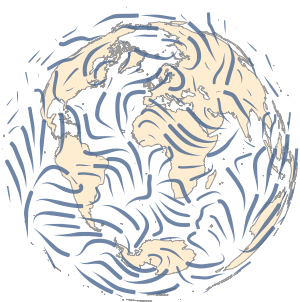
- Use continuous streamlines to show vector fields on the Earth. »
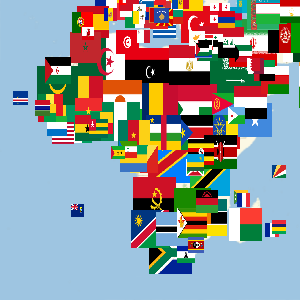
- Use arbitrary content as bubbles to show more information. »
- Customize the color and opacity scales used to display densities.
- Use a wide variety of built-in markers for vectors and streamlines. »
- Easily restrict visualization to specific countries and other regions. »
- Create maps using a wide range of map projections. »
- Plot features on moons and other planets.