


New in OriginPro 2026 and Origin 2026
No trial version yet?
OriginPro and Origin 2026 offer the following new features:
- Flash Fill and Smart Formula
- Find in Project Files
- Bring in Cell Formula from Excel into Origin
- Periodic Refresh for Data Import
- Repeat Last Action & Duplicate Operation
- New Graph Maker
- Graphical Summary for Descriptive Statistics
- Enhanced Speed and Performance
- New Graph Types
- New Apps
- Other Features
Flash Fill and Smart Formula
This features in OriginPro and Origin 2026 allows you to quickly extract desired part of the string from a column containing text, such as extracting numbers from mixed text and numbers. It can also be used to combine contents from multiple columns into the output column.
- Simply type the desired output string in the first row of the output column and press the Enter key.
- Pop-up window will provide a preview of the output column.
- Output column needs to be on the right side of the input column(s).
- Two options are provided: Flash Fill and Smart Formula.
- Flash Fill populates output with no auto update.
- Smart Formula sets up Column Value formula with auto update support.
Find in Project Files
This new feature in version 2026 allows you to search for a specified string in multiple project files.
Key features include:
- Search in all recently opened projects, or projects in specified folder including subfolders.
- Search in folders, workbooks, graphs, notes window, cell notes etc.
- Wildcards supported.
- Detailed view with tooltips on string location within the project.
- Context menu on files found, with options including append to current project, open as new instance etc.
- Minimize dialog and continue with your work while the search continues in the background.
Bring in Cell Formula from Excel into Origin
In OriginPro and Origin 2026, you can bring in cell formula from Excel to Origin to continue with your calculations in Origin and then create your publication-quality graphs and perform advanced analysis operations.
- Copy-paste a range of cells from Excel, or use Excel Data Connector.
- Turn on Show Formula in Excel, then copy and paste into Origin using the new menu option: Paste (Keep Excel Formula)
- Check the Import Raw Formula check box in the data connector Options dialog to import Excel sheets/book with formula.
- Ctrl+` in Origin to toggle between formula and value view.
- Ctrl+E in Origin to toggle highlighting of formula cells. Excel formula not supported in Origin will be highlighted with a different color and #Error text.
- Convert cells with formula optionally to value with formula removed.
- Find and Replace is supported for formula in cells.
- More Excel functions supported in Origin, including average, rand, stdev.s, stdev.p
- Copy-paste formula is also supported from Google Sheets
Periodic Refresh for Data Import
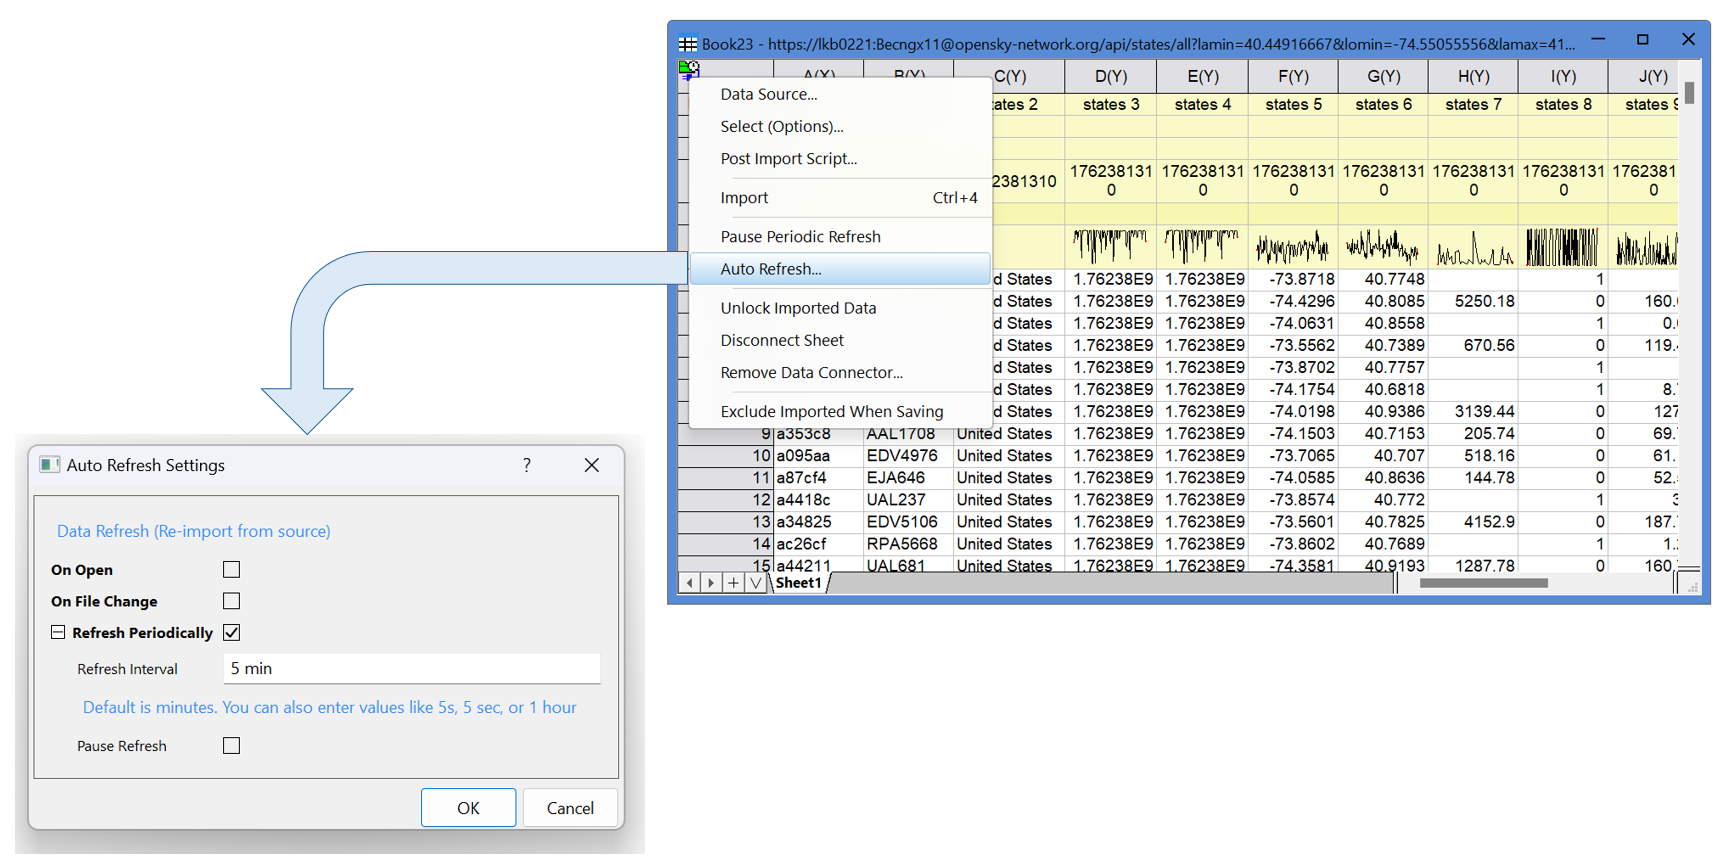
You can set your data connector to periodically re-import data from the data source in version 2026 of Origin and OriginPro. This is useful in situations where the data changes or more data is added to the source and you want it periodically updated in Origin.
- Turn on "Refresh Periodically" check box in the Auto Refresh Settings dialog.
- Set the refresh rate to anywhere from 5 seconds to 3 days.
- Works for local files, network files, database and web/cloud based data sources.
- Once refresh rate is set, it can be paused any time from the options dialog.
- Data connector icon in workbook will display the timer icon and tooltip will show remaining time for the next refresh.
Repeat Last Action & Duplicate Operation
OriginPro and Origin 2026 introduce a set of convenience features to repeat actions and duplication operations:
- CTRL+Backspace to repeat last action, such as create same graph from another data column.
- CTRLl+Shift+Backspace to reopen last used analysis/graphing/App dialog.
- Duplicate Operation: Perform analysis such as nonlinear fit, then use context menu on operation lock to repeat analysis on other data sheets.
New Graph Maker
A new and improved Graph Maker has been added in OriginPro and Origin 2026, accessible from the "Plot" menu:
- More plot types supported, including Run and Pareto Charts.
- Multiple datasets and grouping supported for statistical graphs.
- Use text/categorical columns to split the graphs by multiple panels in a single page and/or multiple pages.
- Re-open dialog from the Change Parameter context menu in the graph's lock icon to make changes.
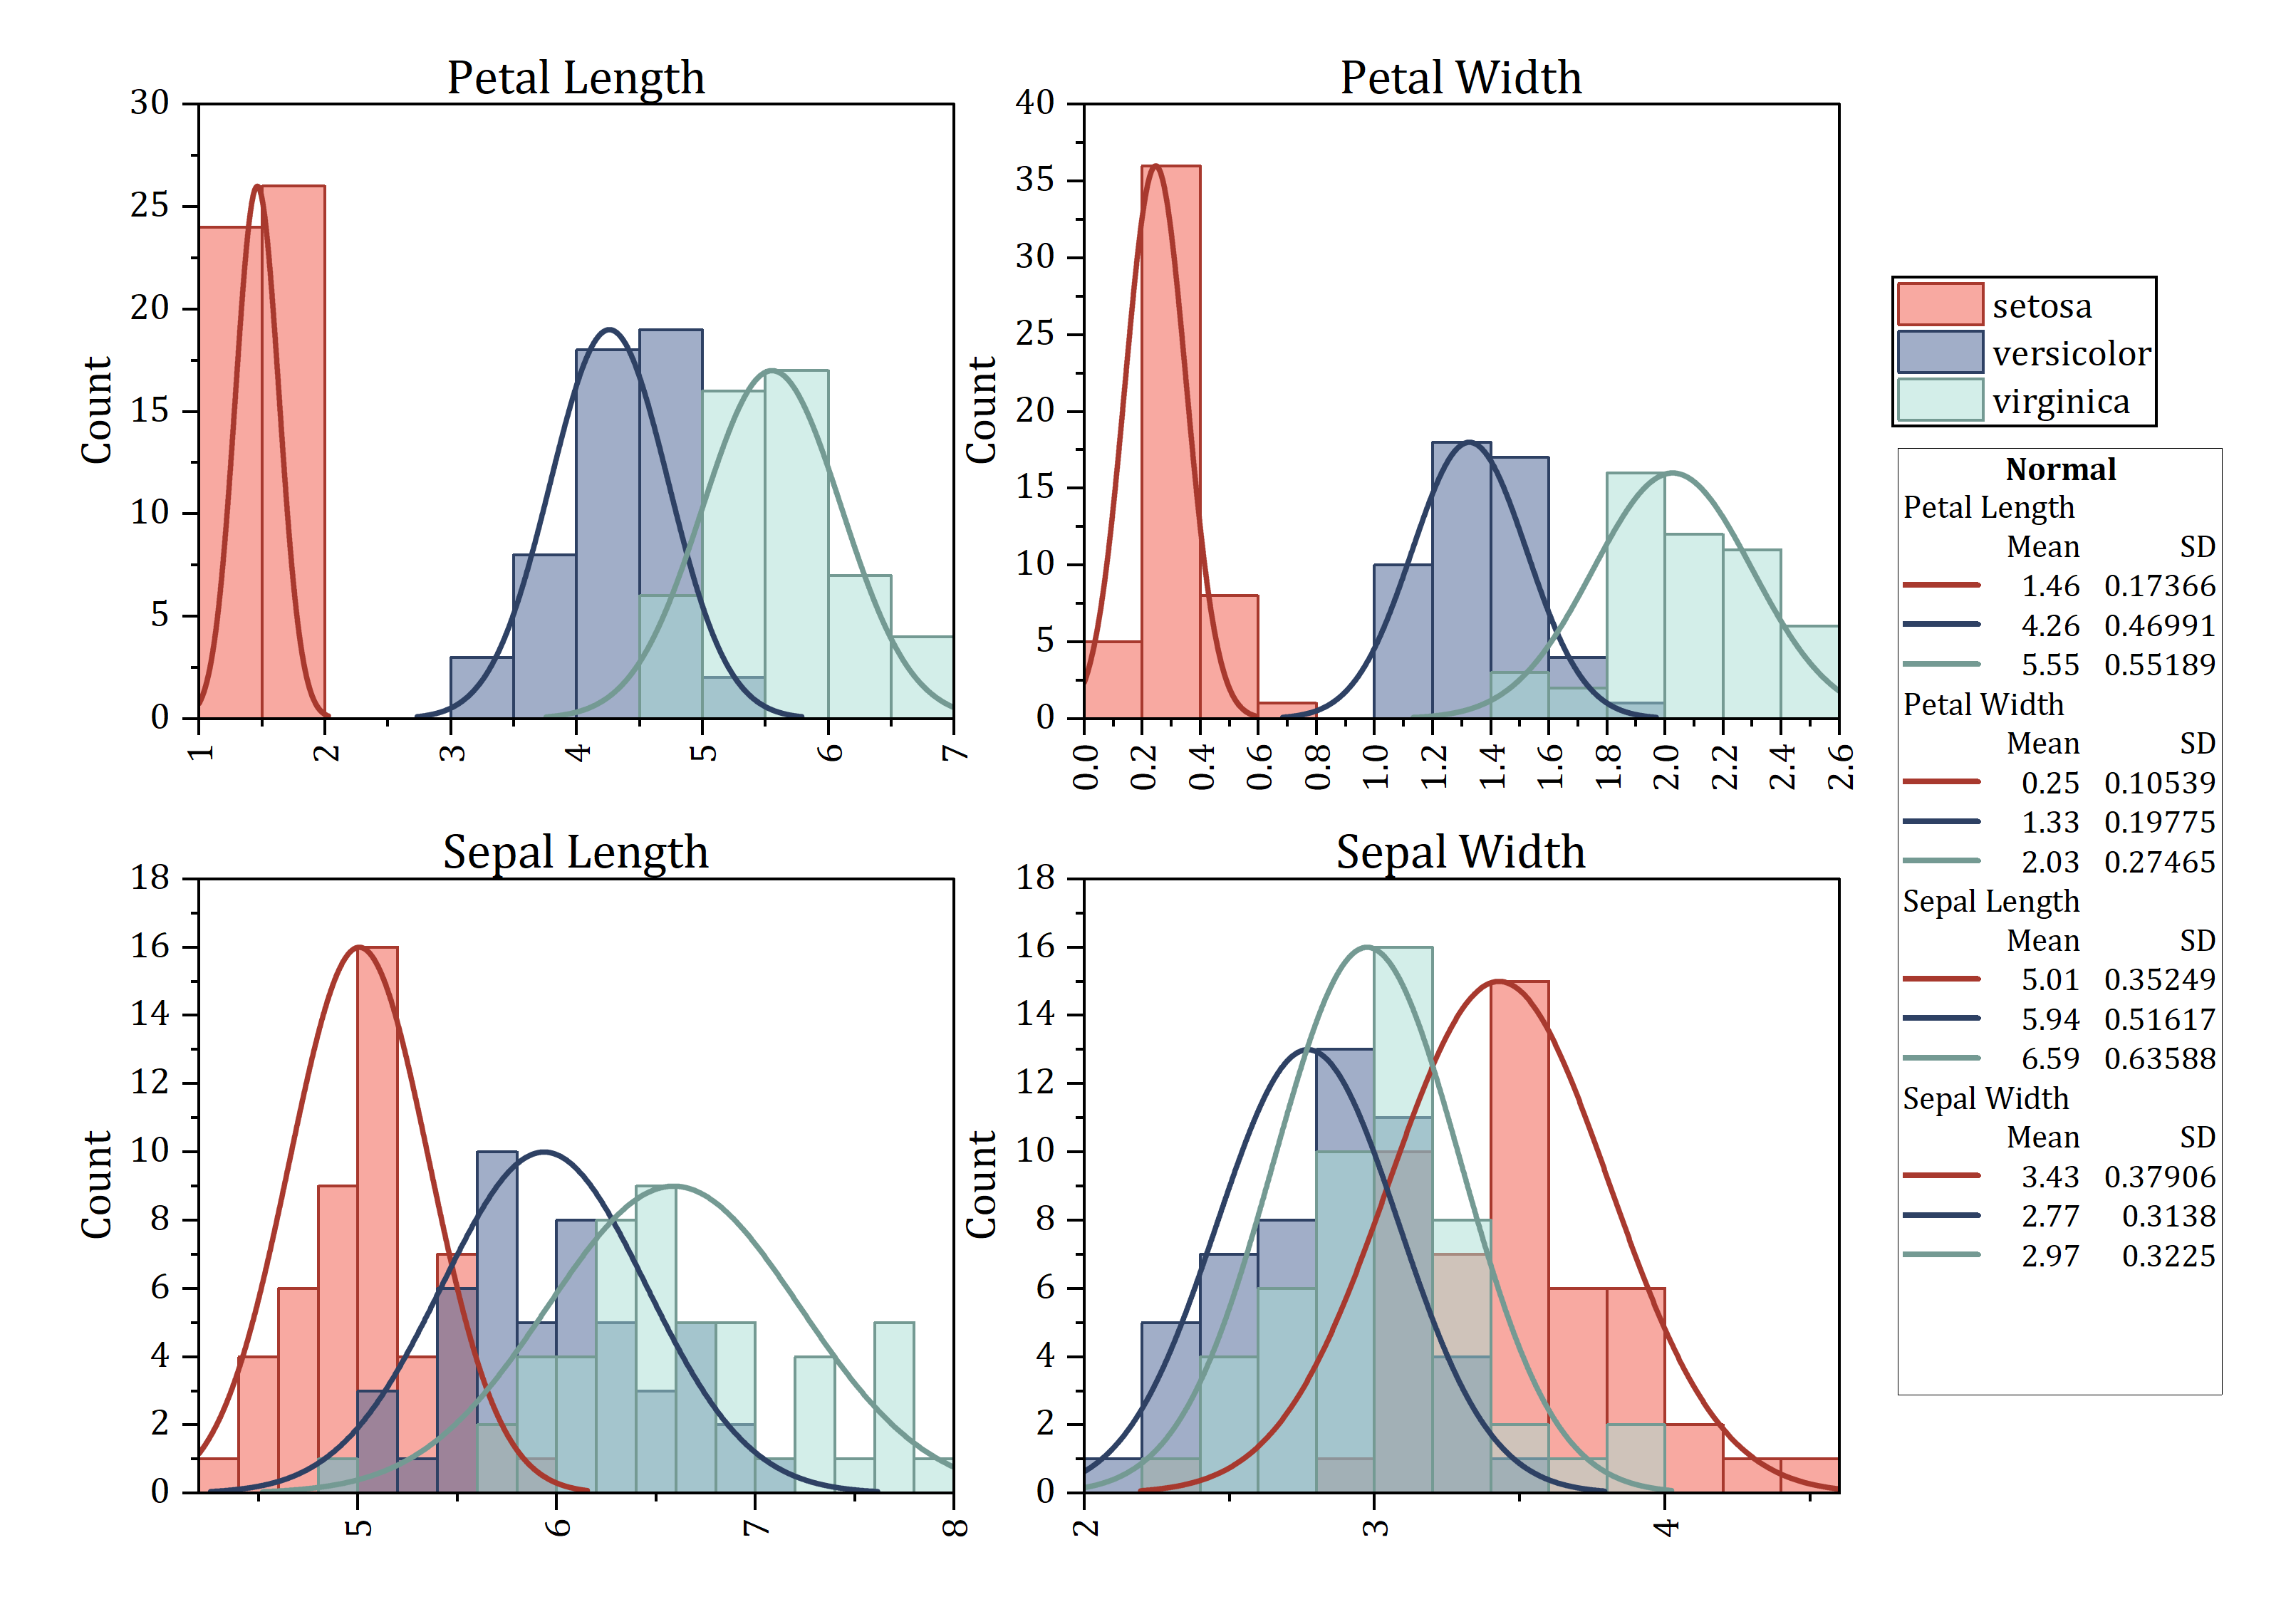
Graphical Summary for Descriptive Statistics
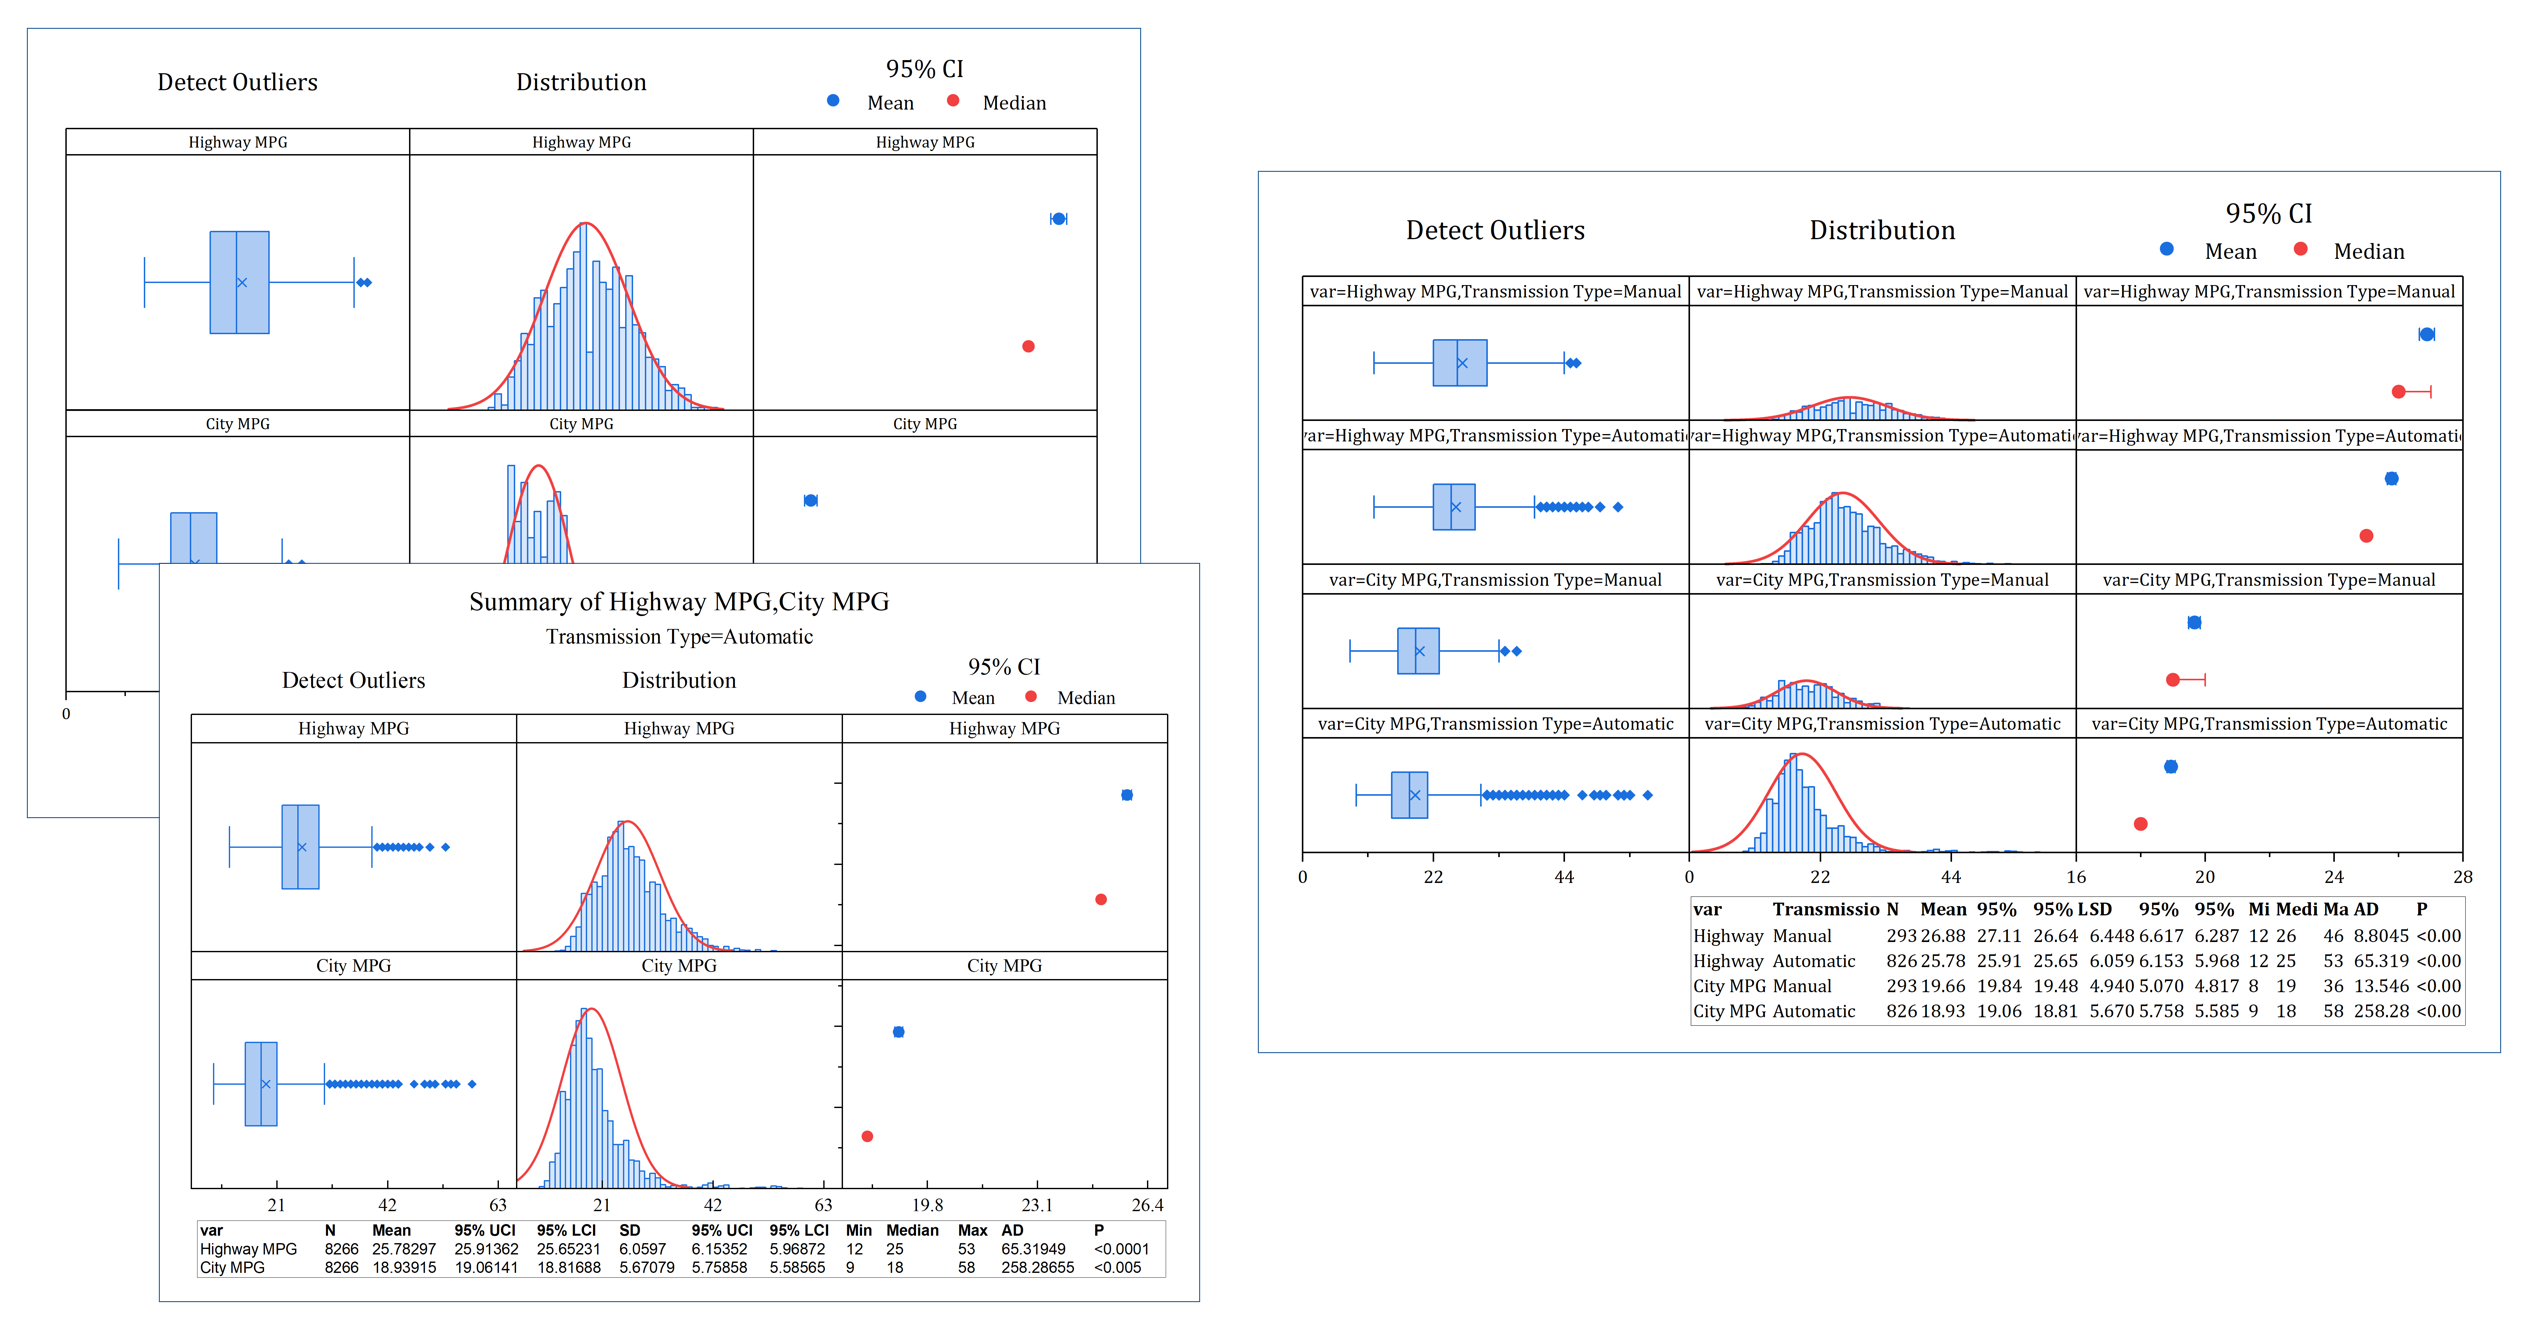
Summary graphs can be separate graphs, or arranged side by side for easy comparison.
In OriginPro and Origin 2026, a new Graphical Summary tool is now available under descriptive statistics:
- View your data as clear, interactive charts to identify trends and outliers at a glance.
- Summary graphs can be arranged as separate graphs, or arranged side-by-side for comparison by variable, by group, or all in one.
- Summary statistics include Anderson-Darling test for normality.
Summary graphs can be separate graphs, or arranged side by side for easy comparison.
Enhanced Speed and Performance
Several speed and performance improvements have been added to OriginPro and Origin 2026:
- Multi-thread support for vector calculation in Set Column Values and Labtalk assignment, at least twice as fast.
- Set Column Value with IF function calling IsEmpty is more than twice faster.
- Saving large mixed-series Origin projects is approximately 40% faster.
- Faster Find and Replace in worksheet containing many formula cells.
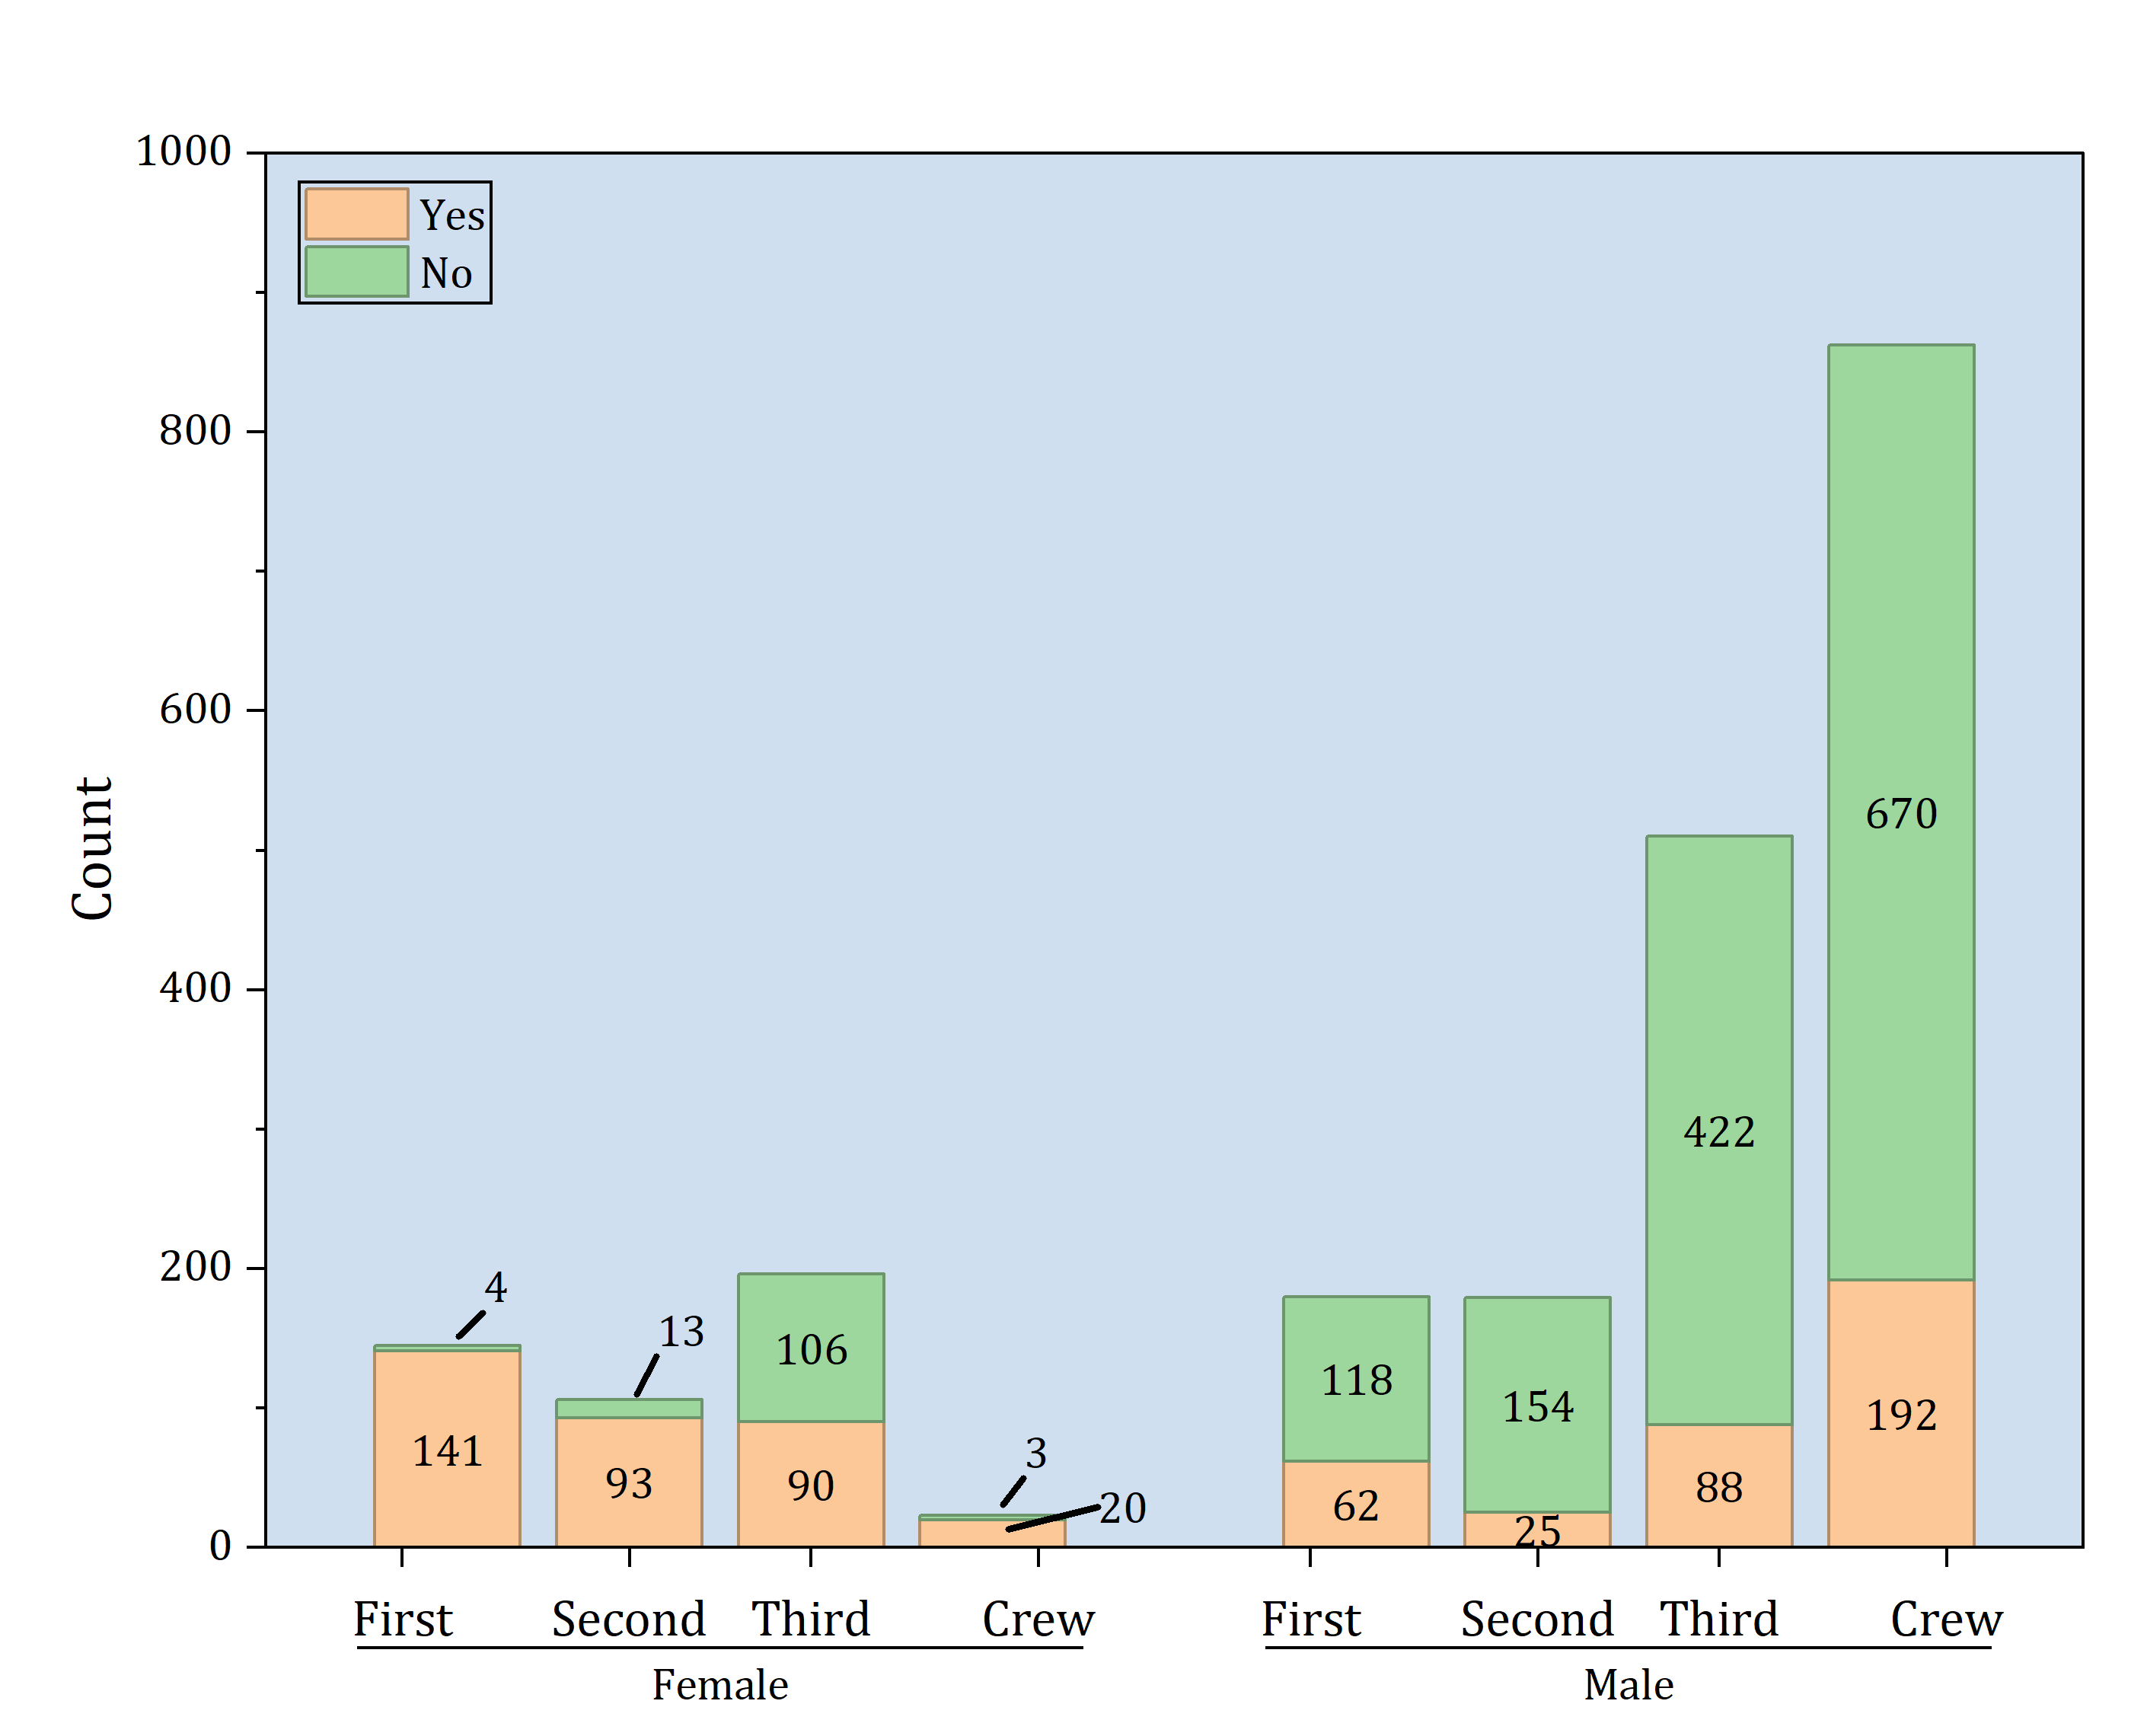
New Graph Types
The following new graph types have been added OriginPro and Origin 2026:
- Cause-and-Effect Diagram
- Frequency Chart: Column, Bar, Pie, Doughnut
- Double X
- Decision Tree
- Stem and Leaf Plot
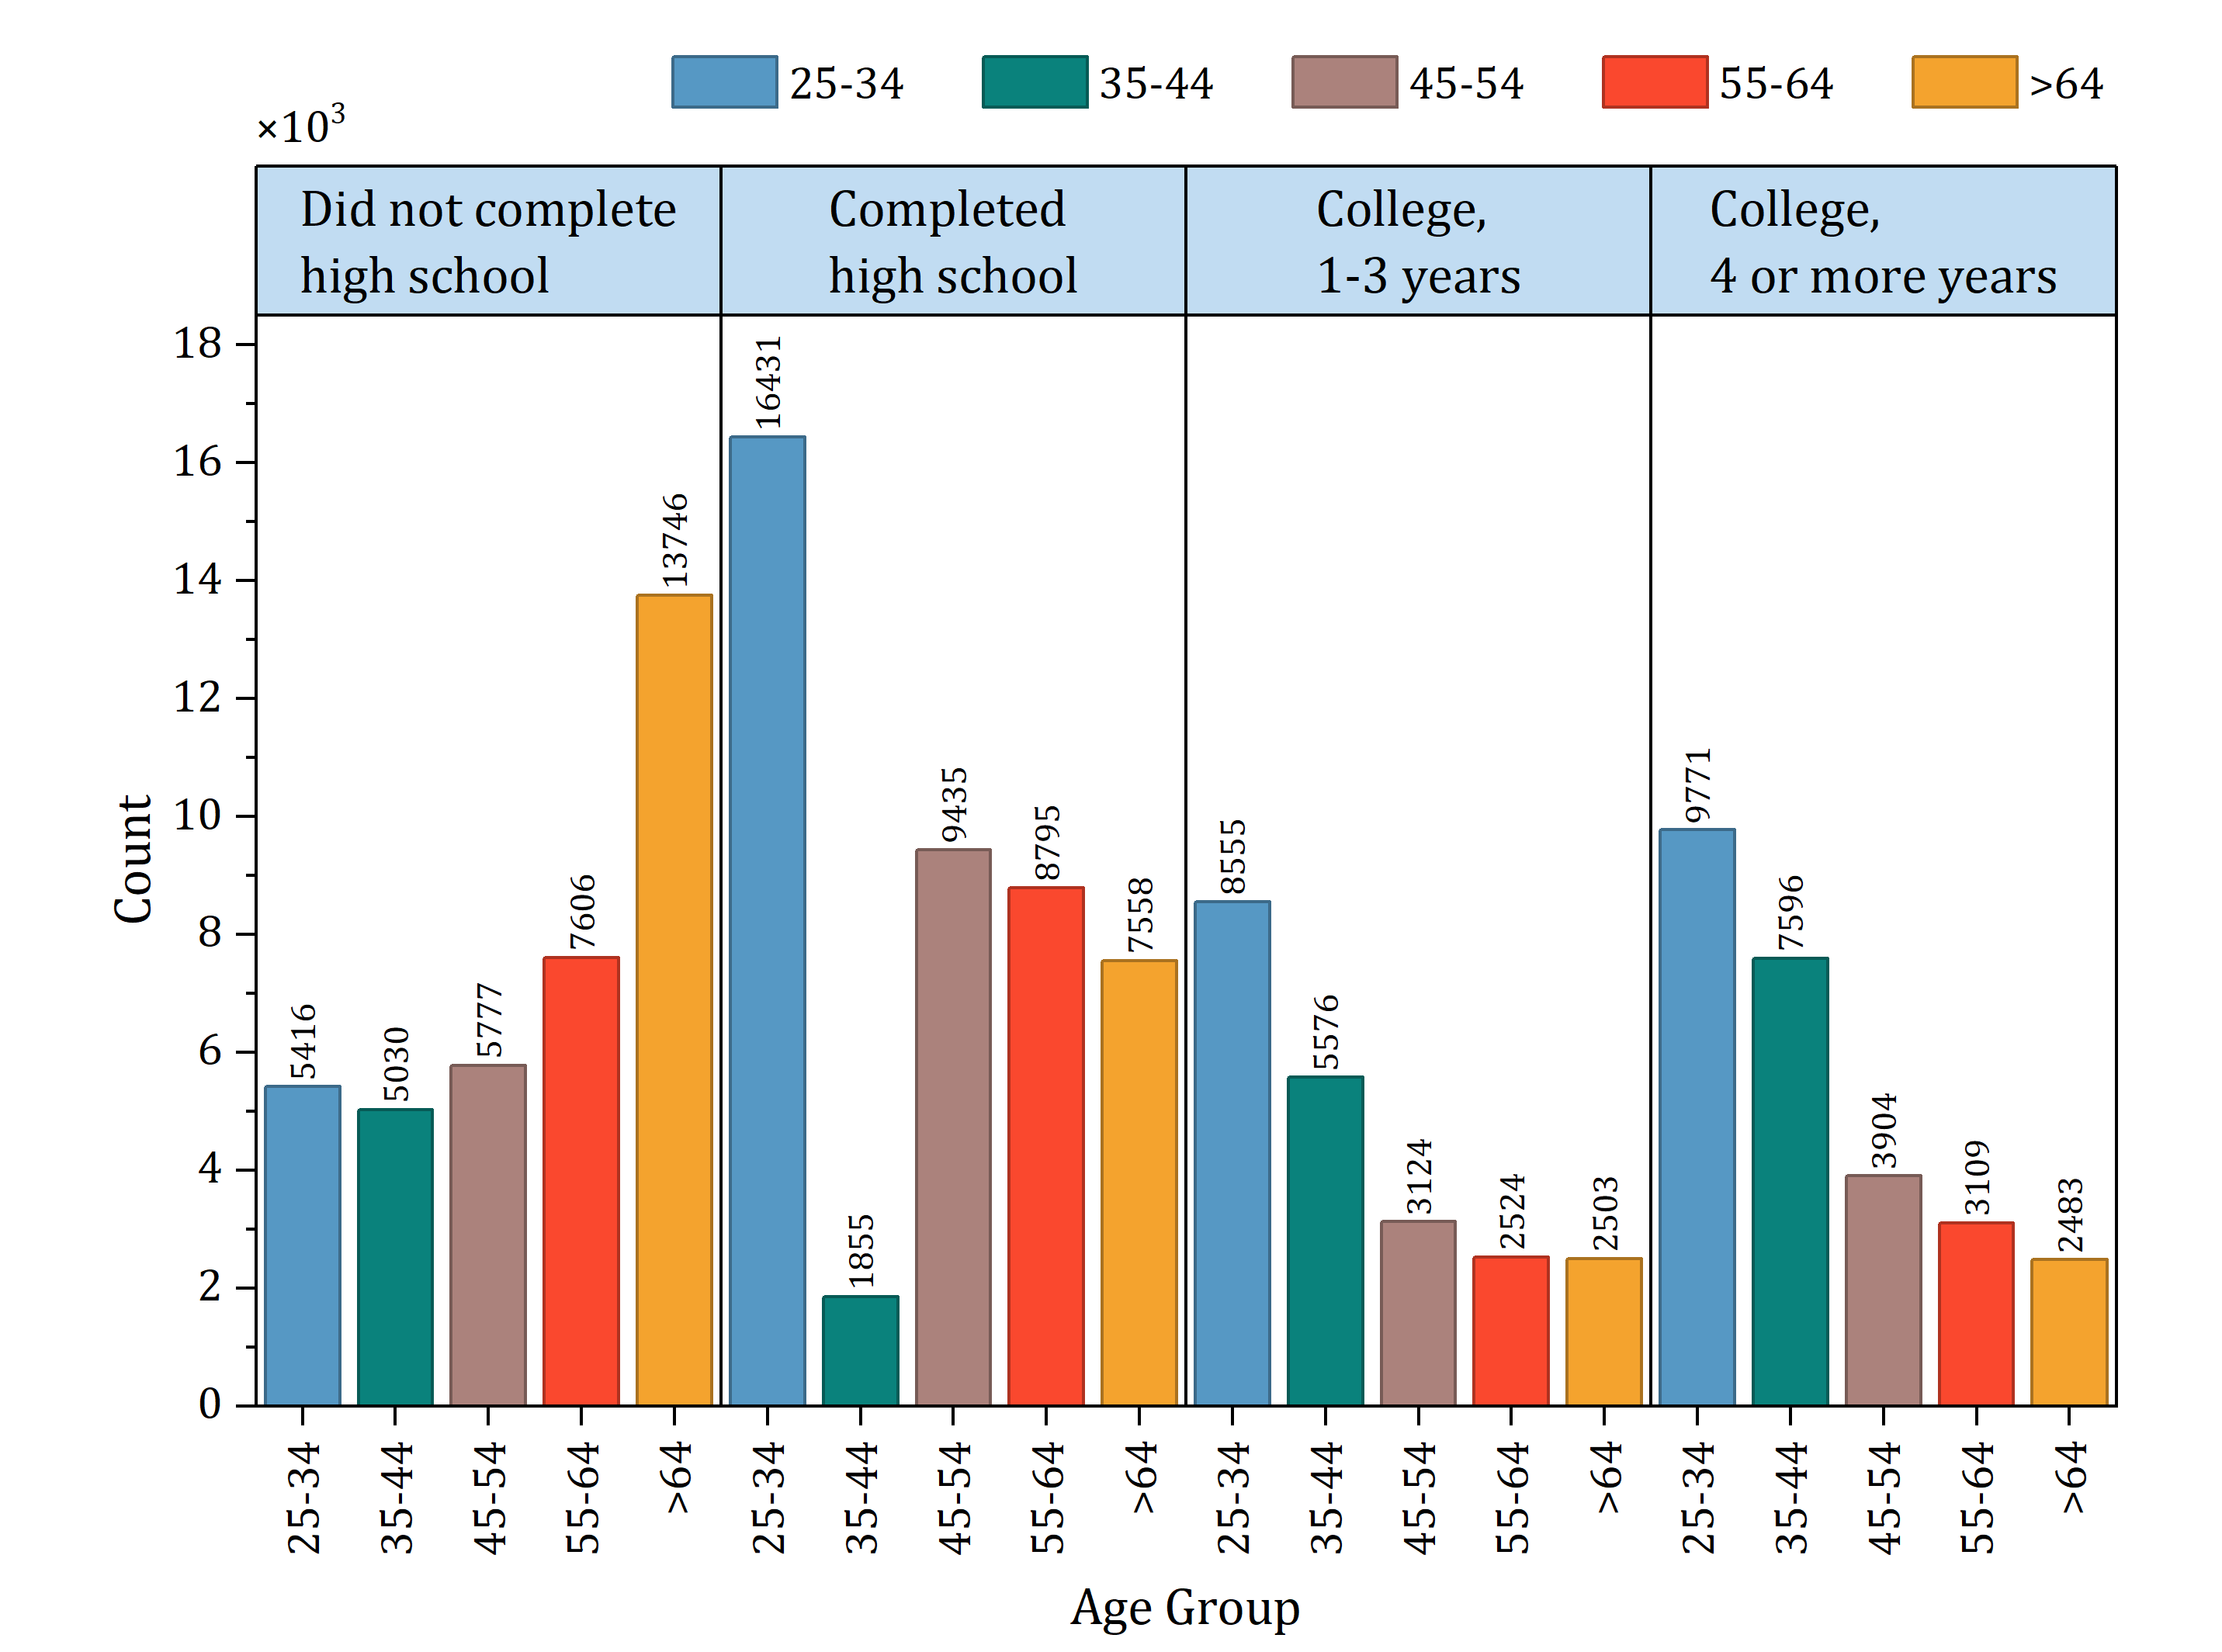
- Grouped Histogram
- Grouped Pareto Chart
- Grouped Scatter Plot
- Improved Grouped Column Chart
- Conclusion Charts in t-test Report Sheets
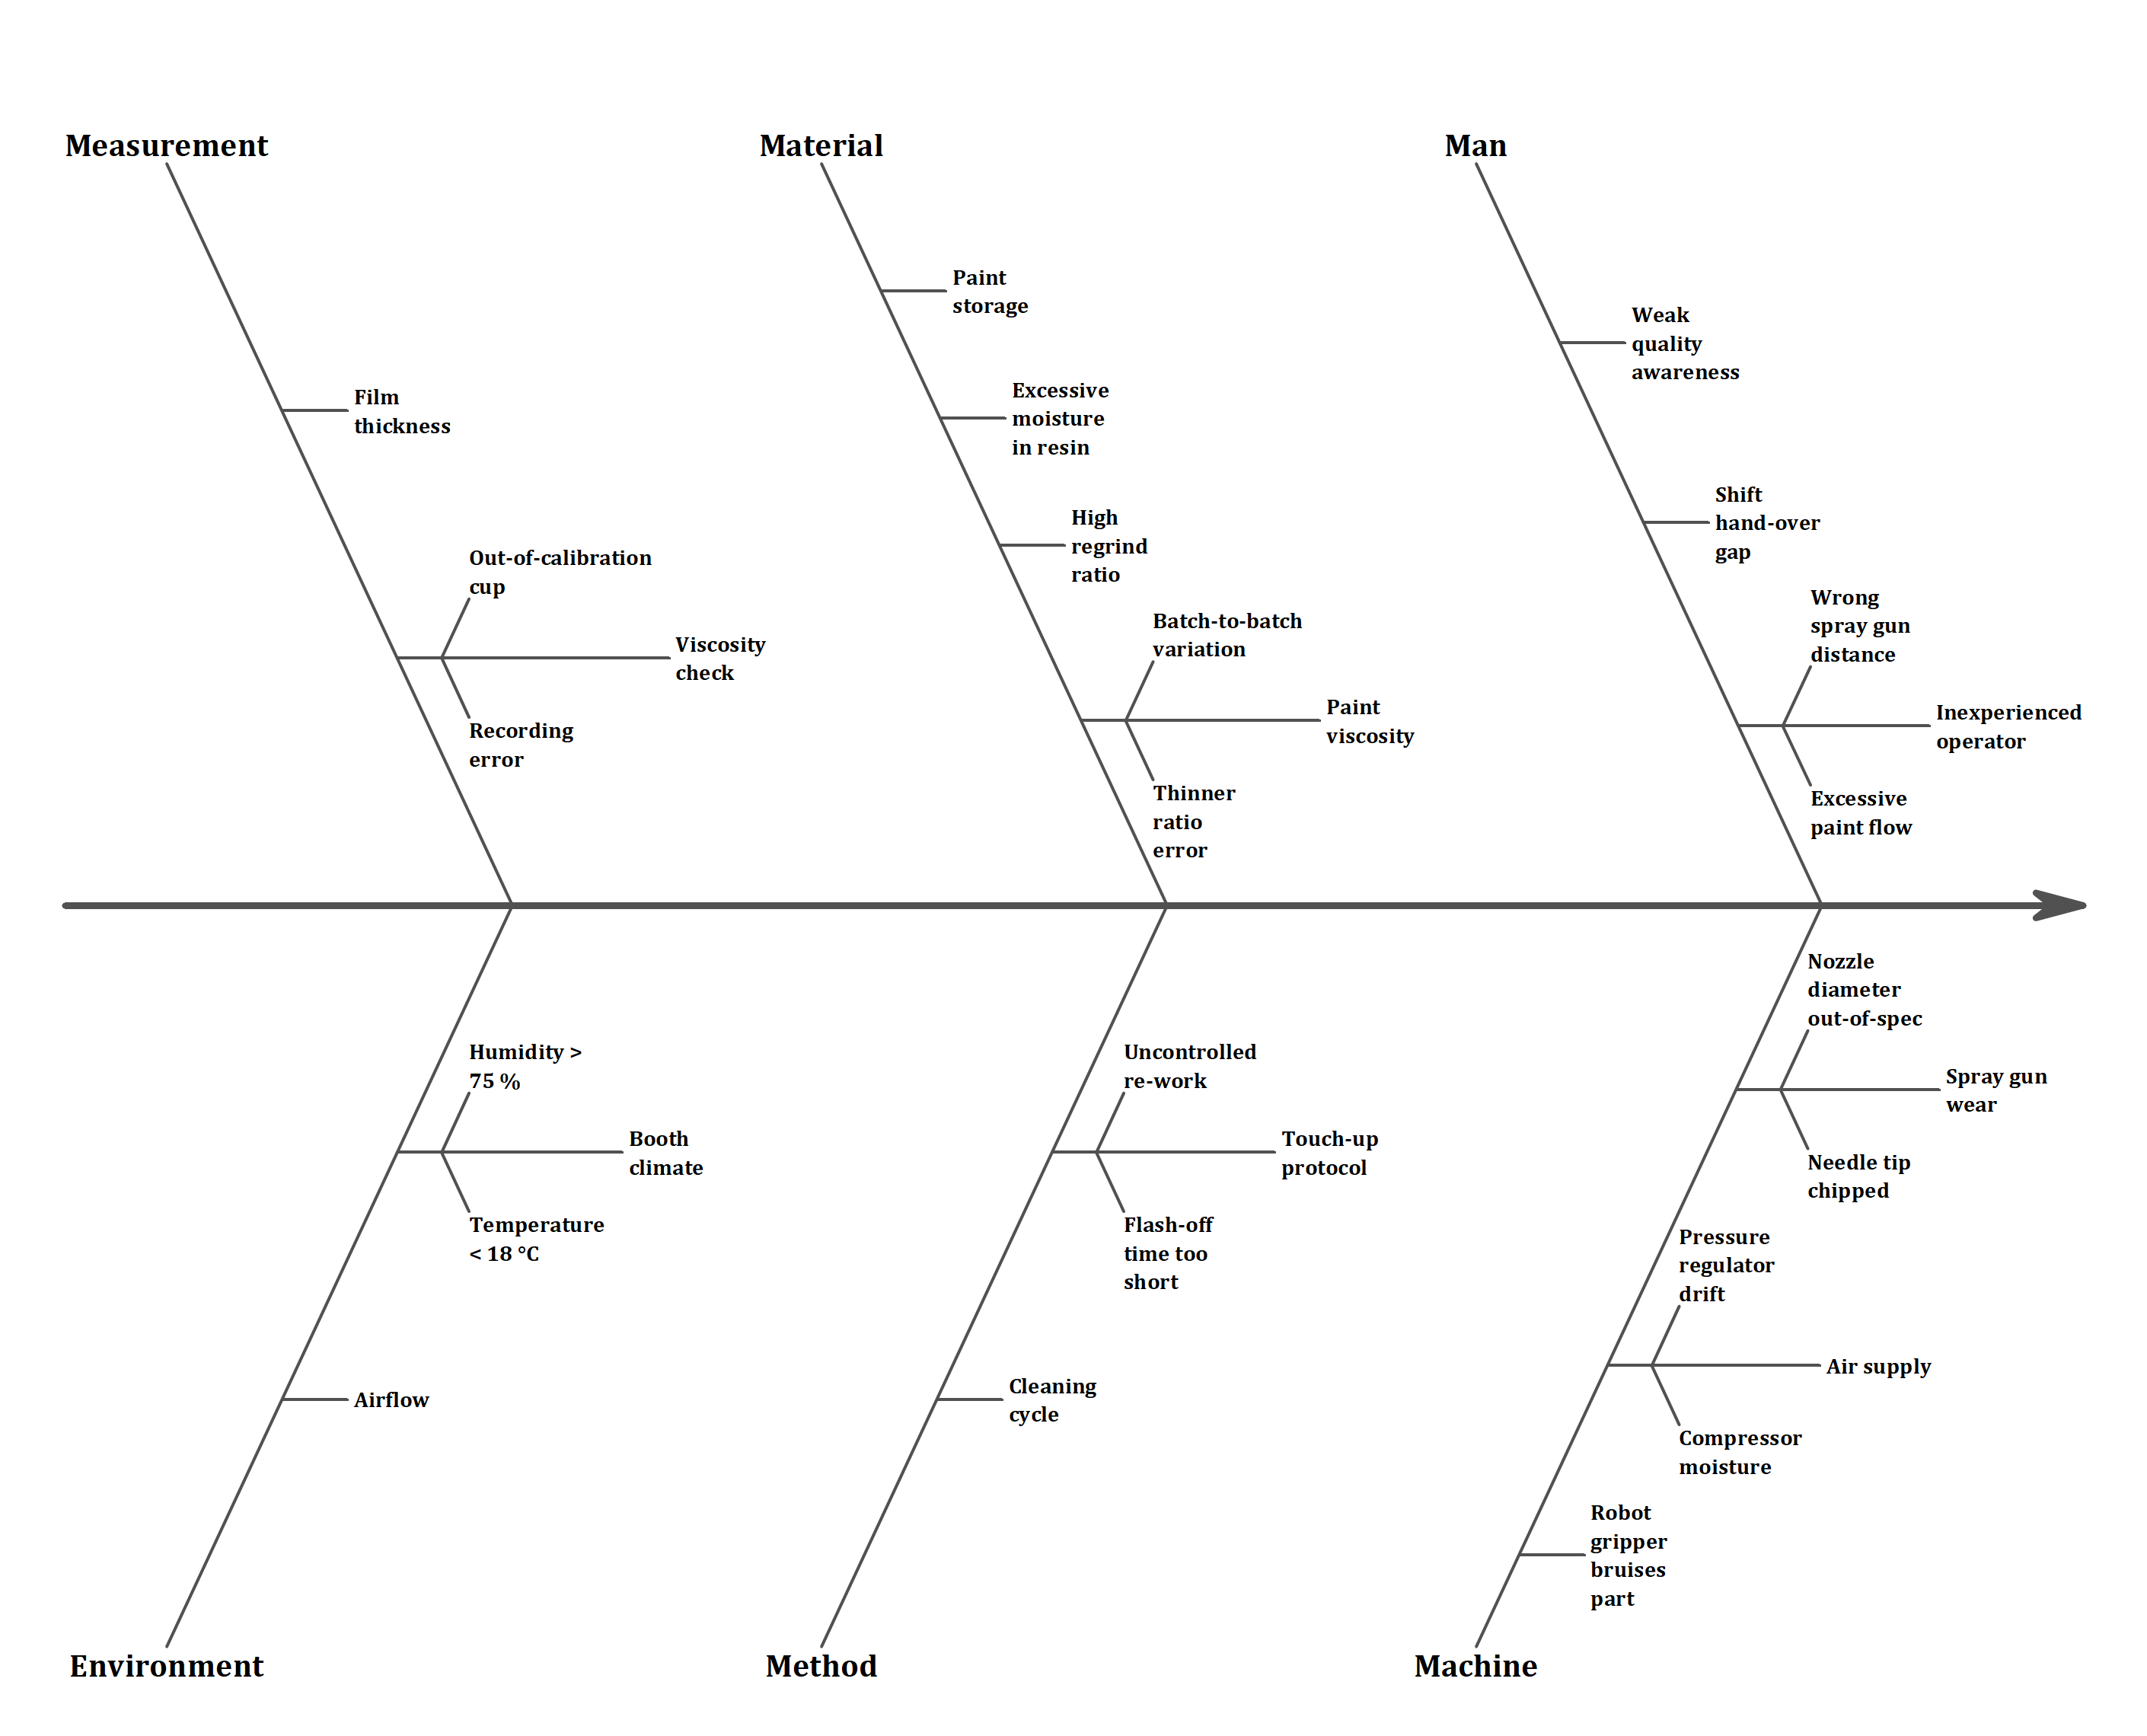
Cause-and-Effect Diagram
Frequency Chart with Nested Counts
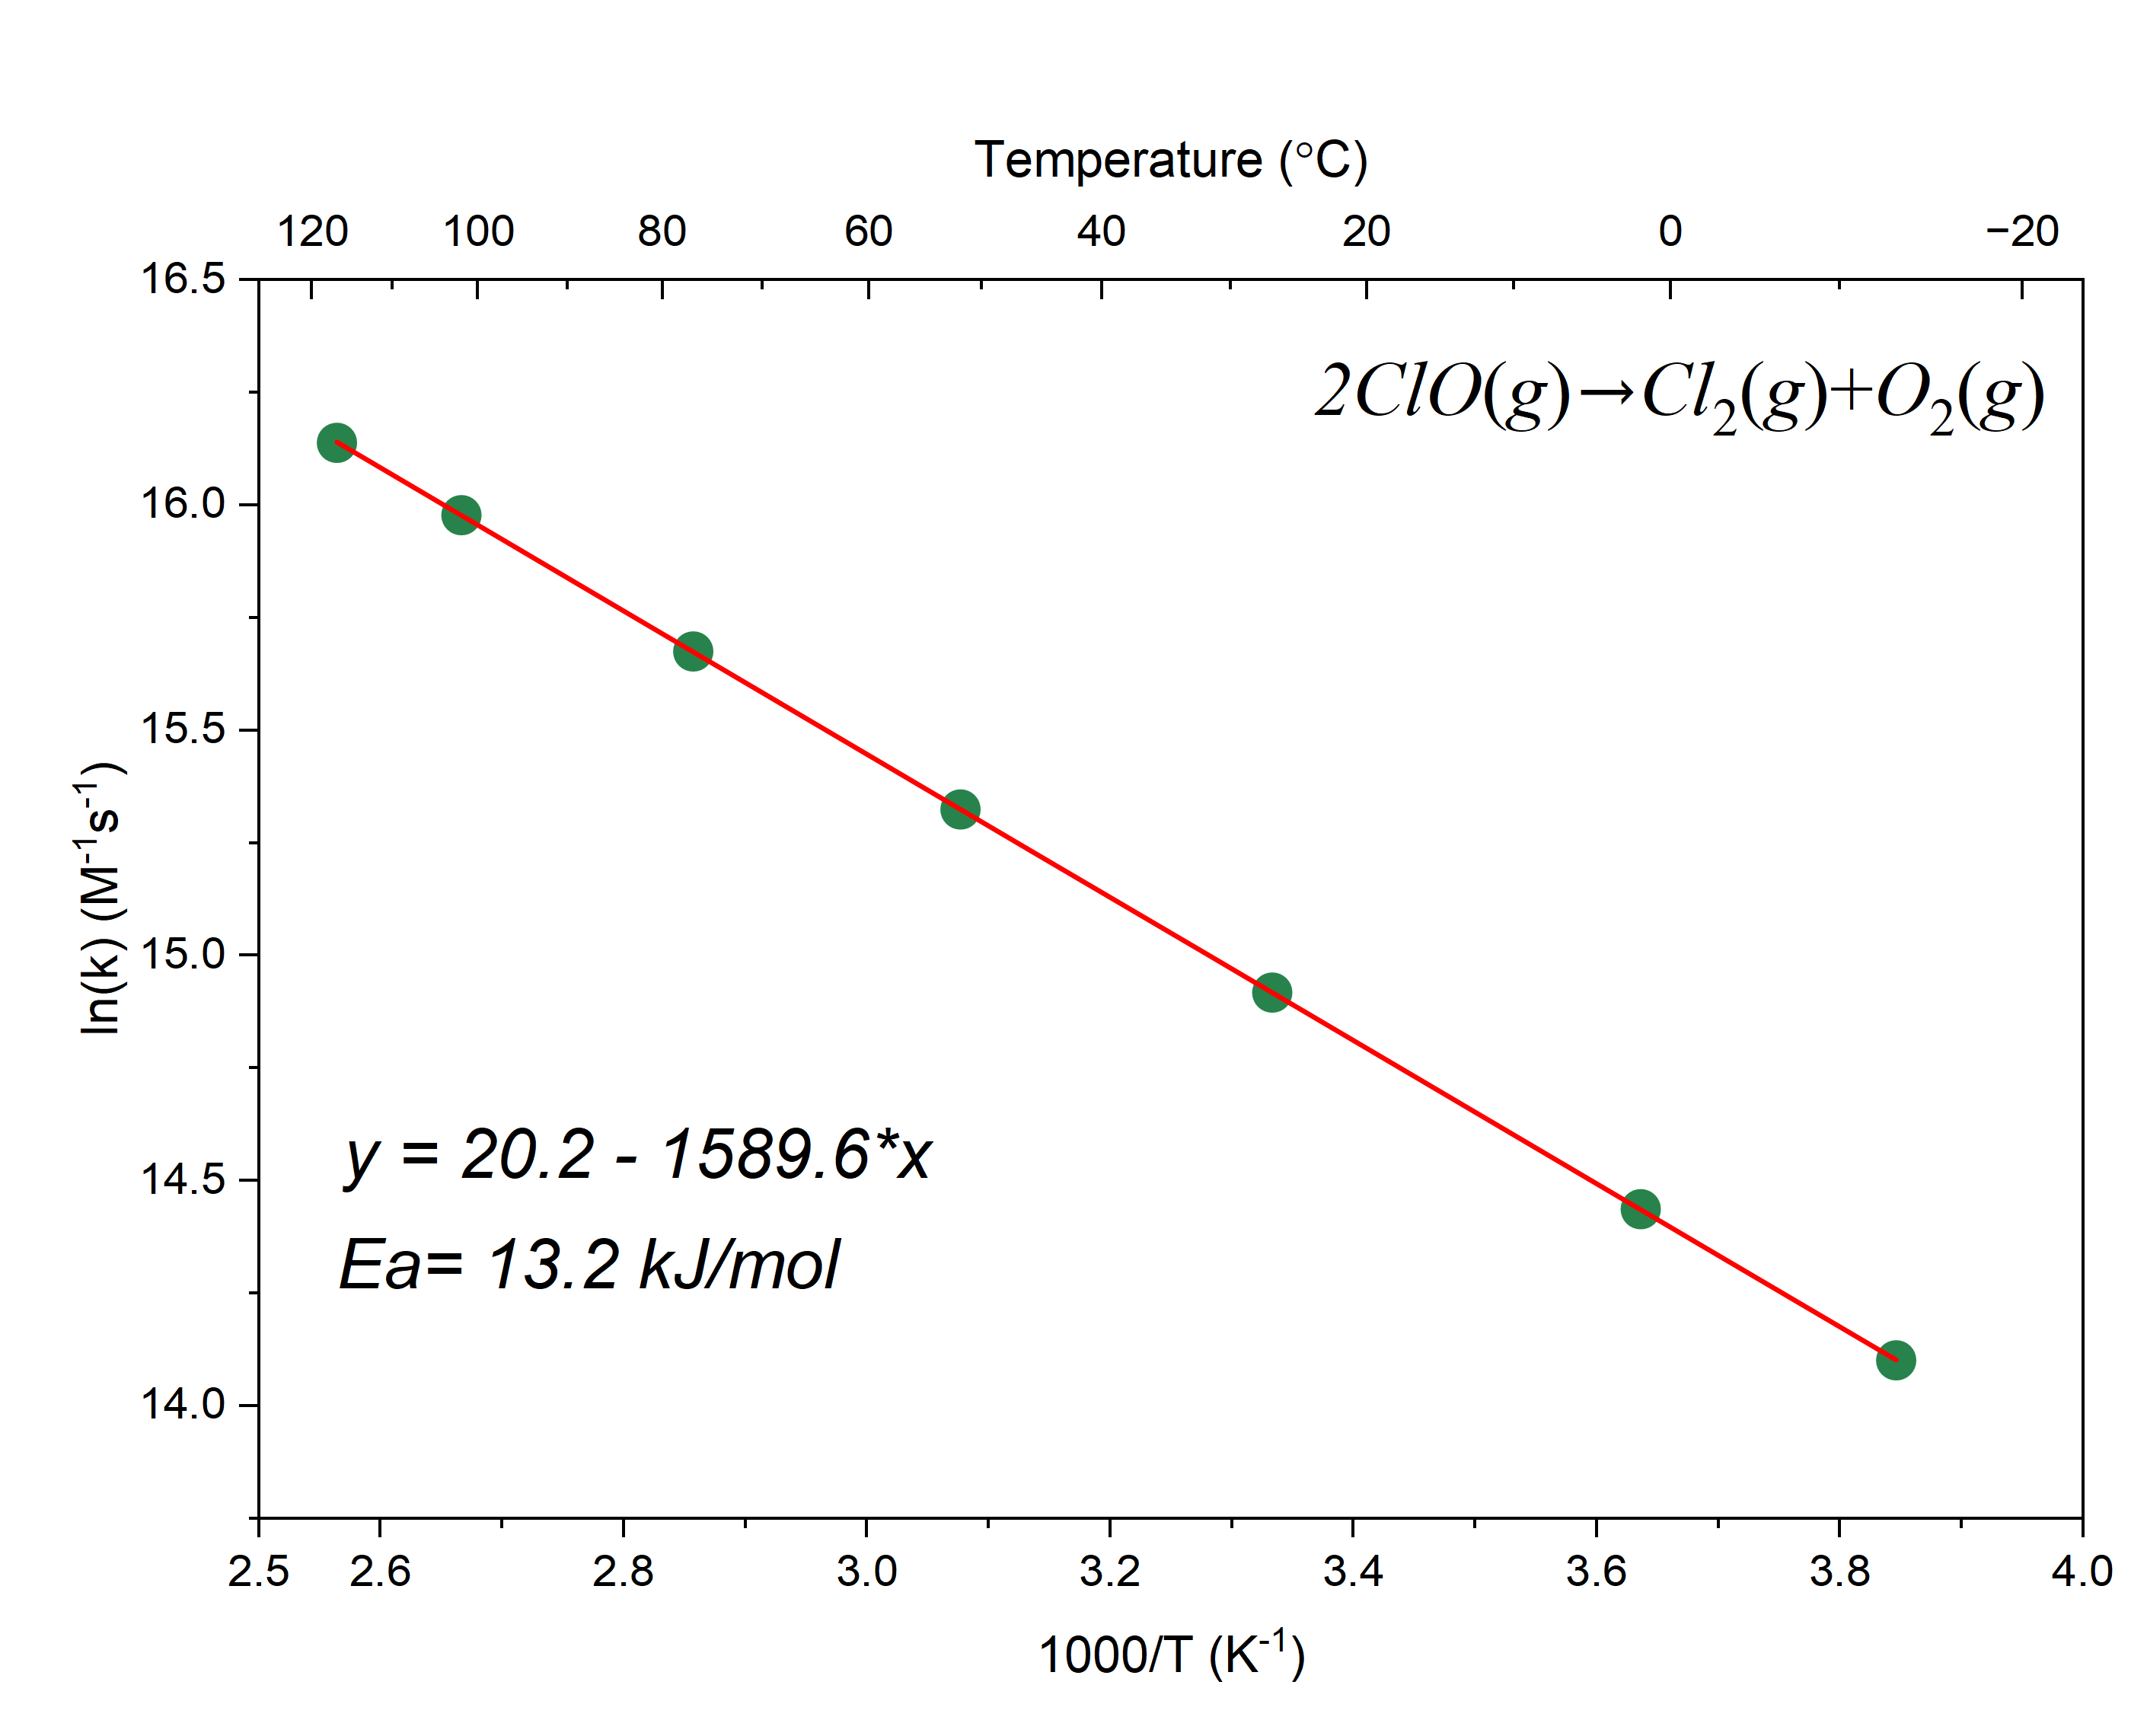
Arrhenius and other Double-X templates are now available from the Plot Menu
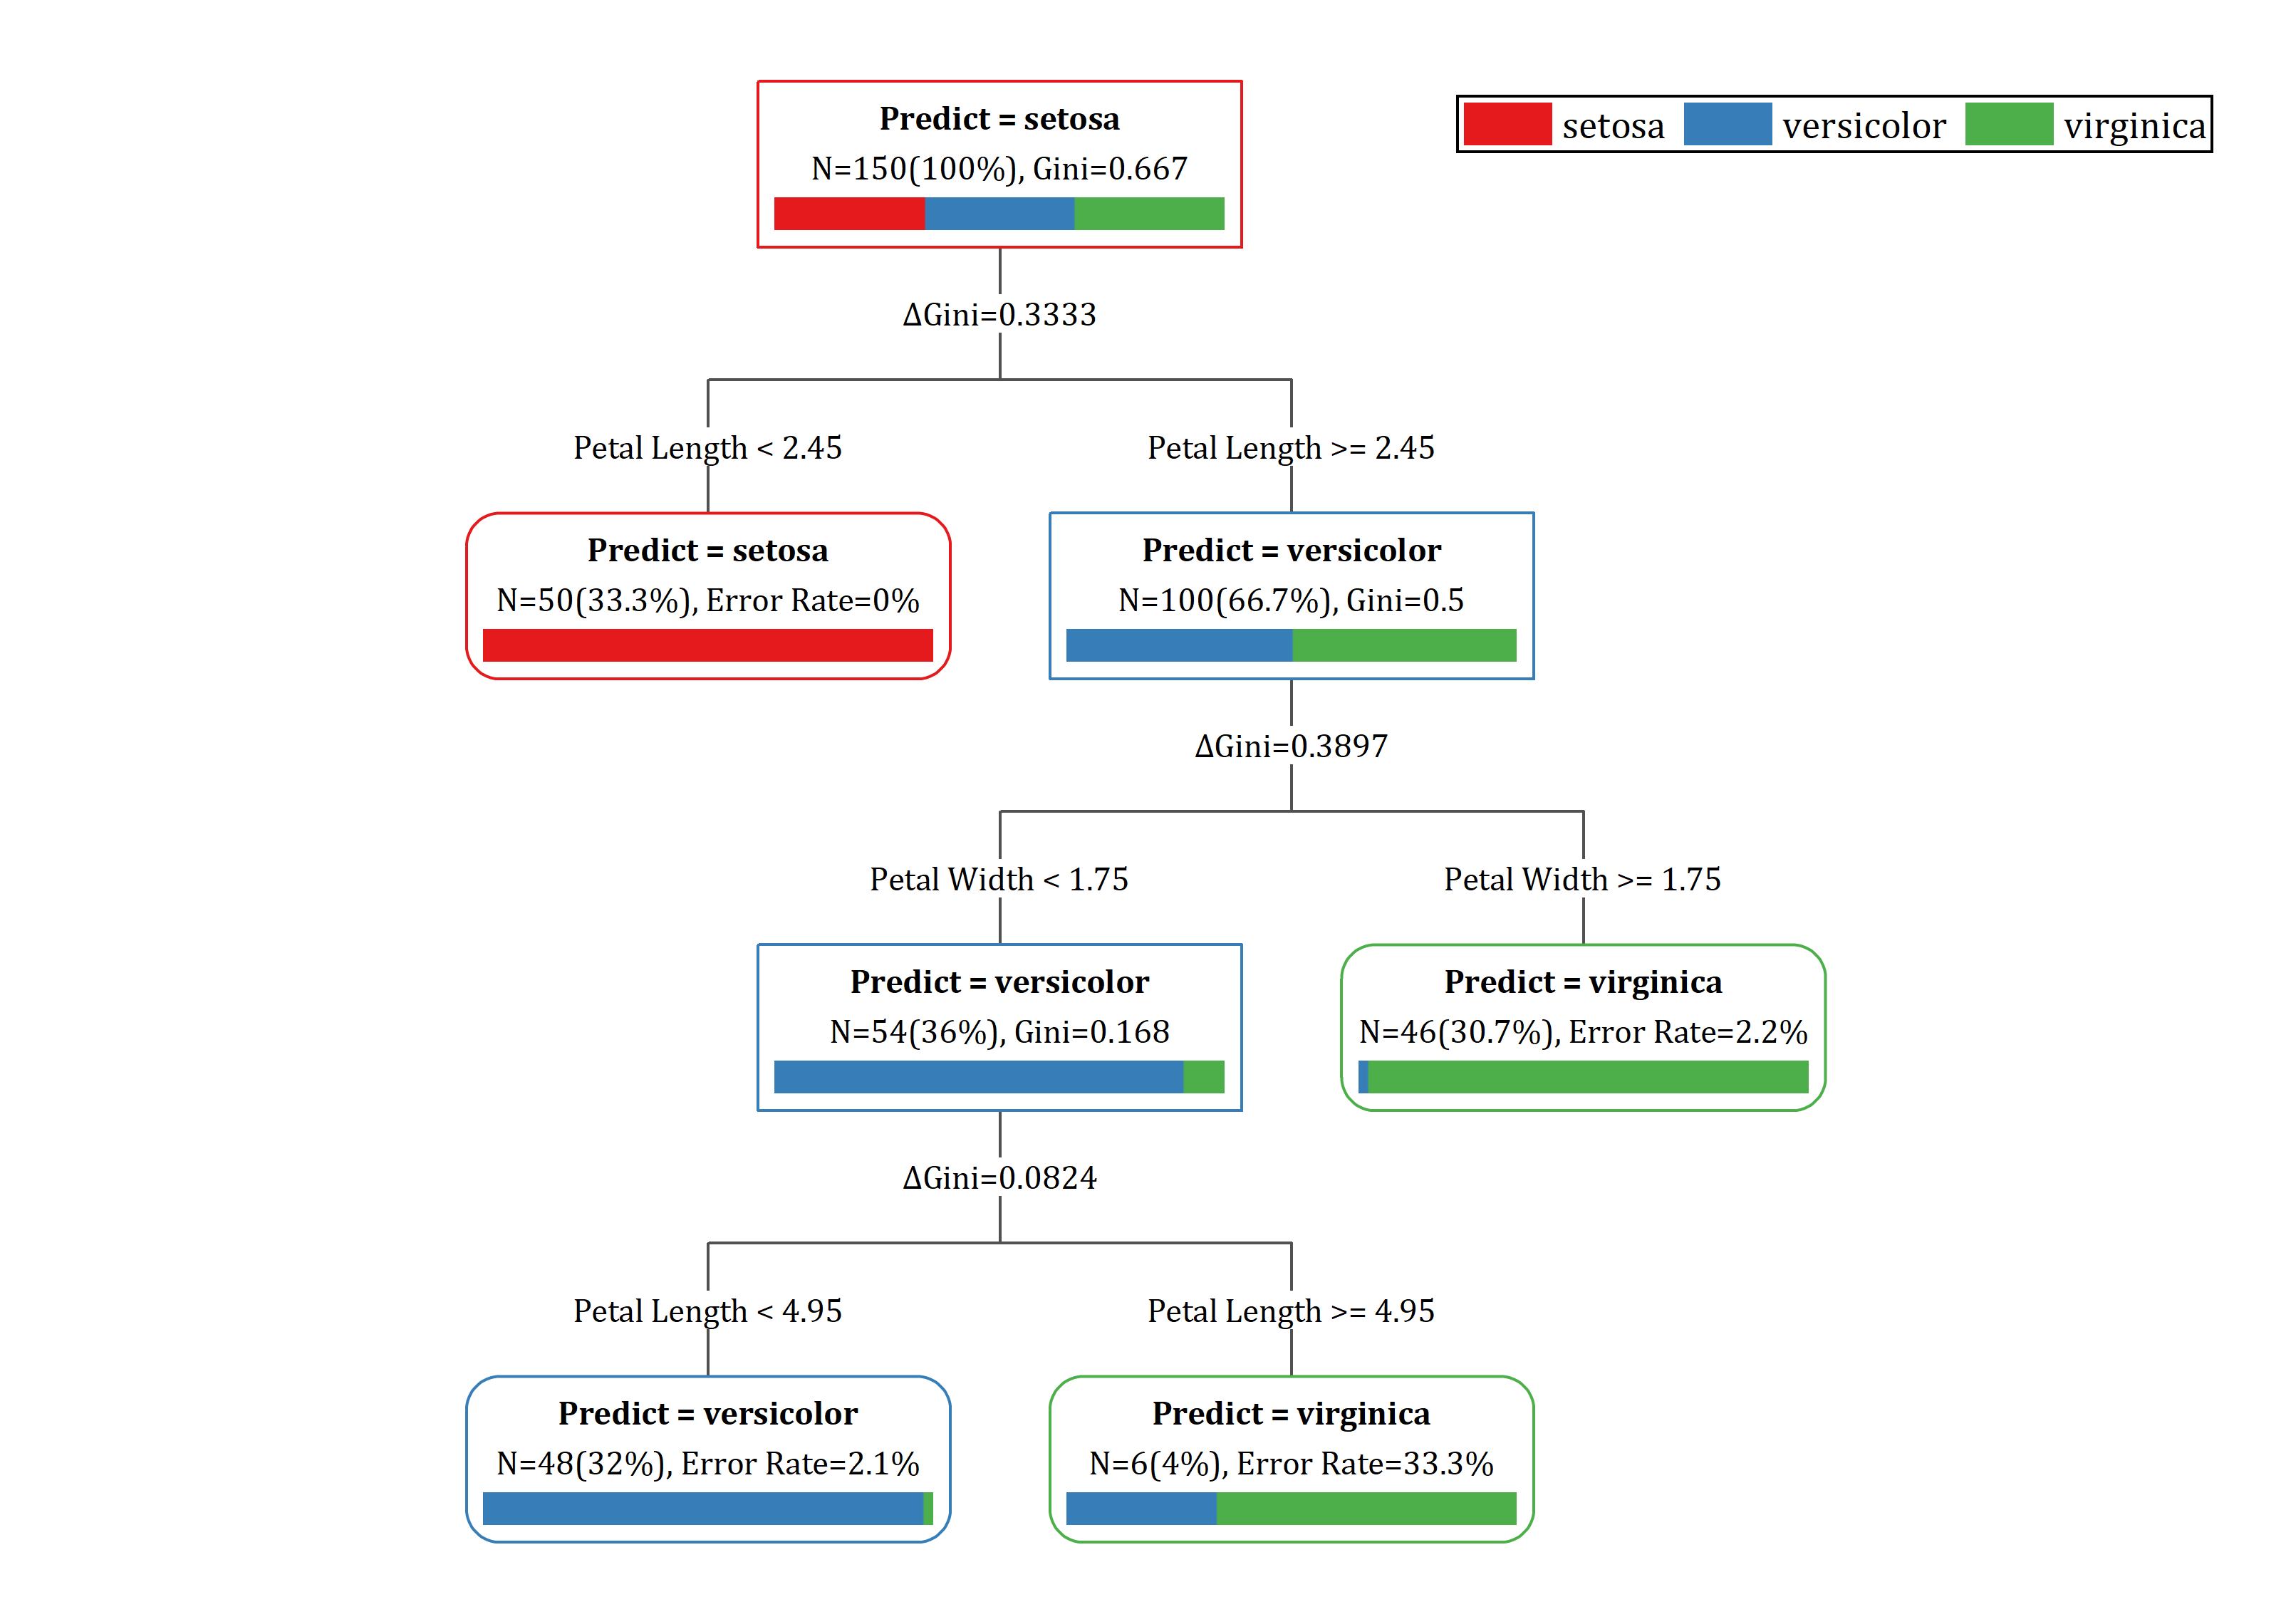
Decision Tree
Grouped Histogram
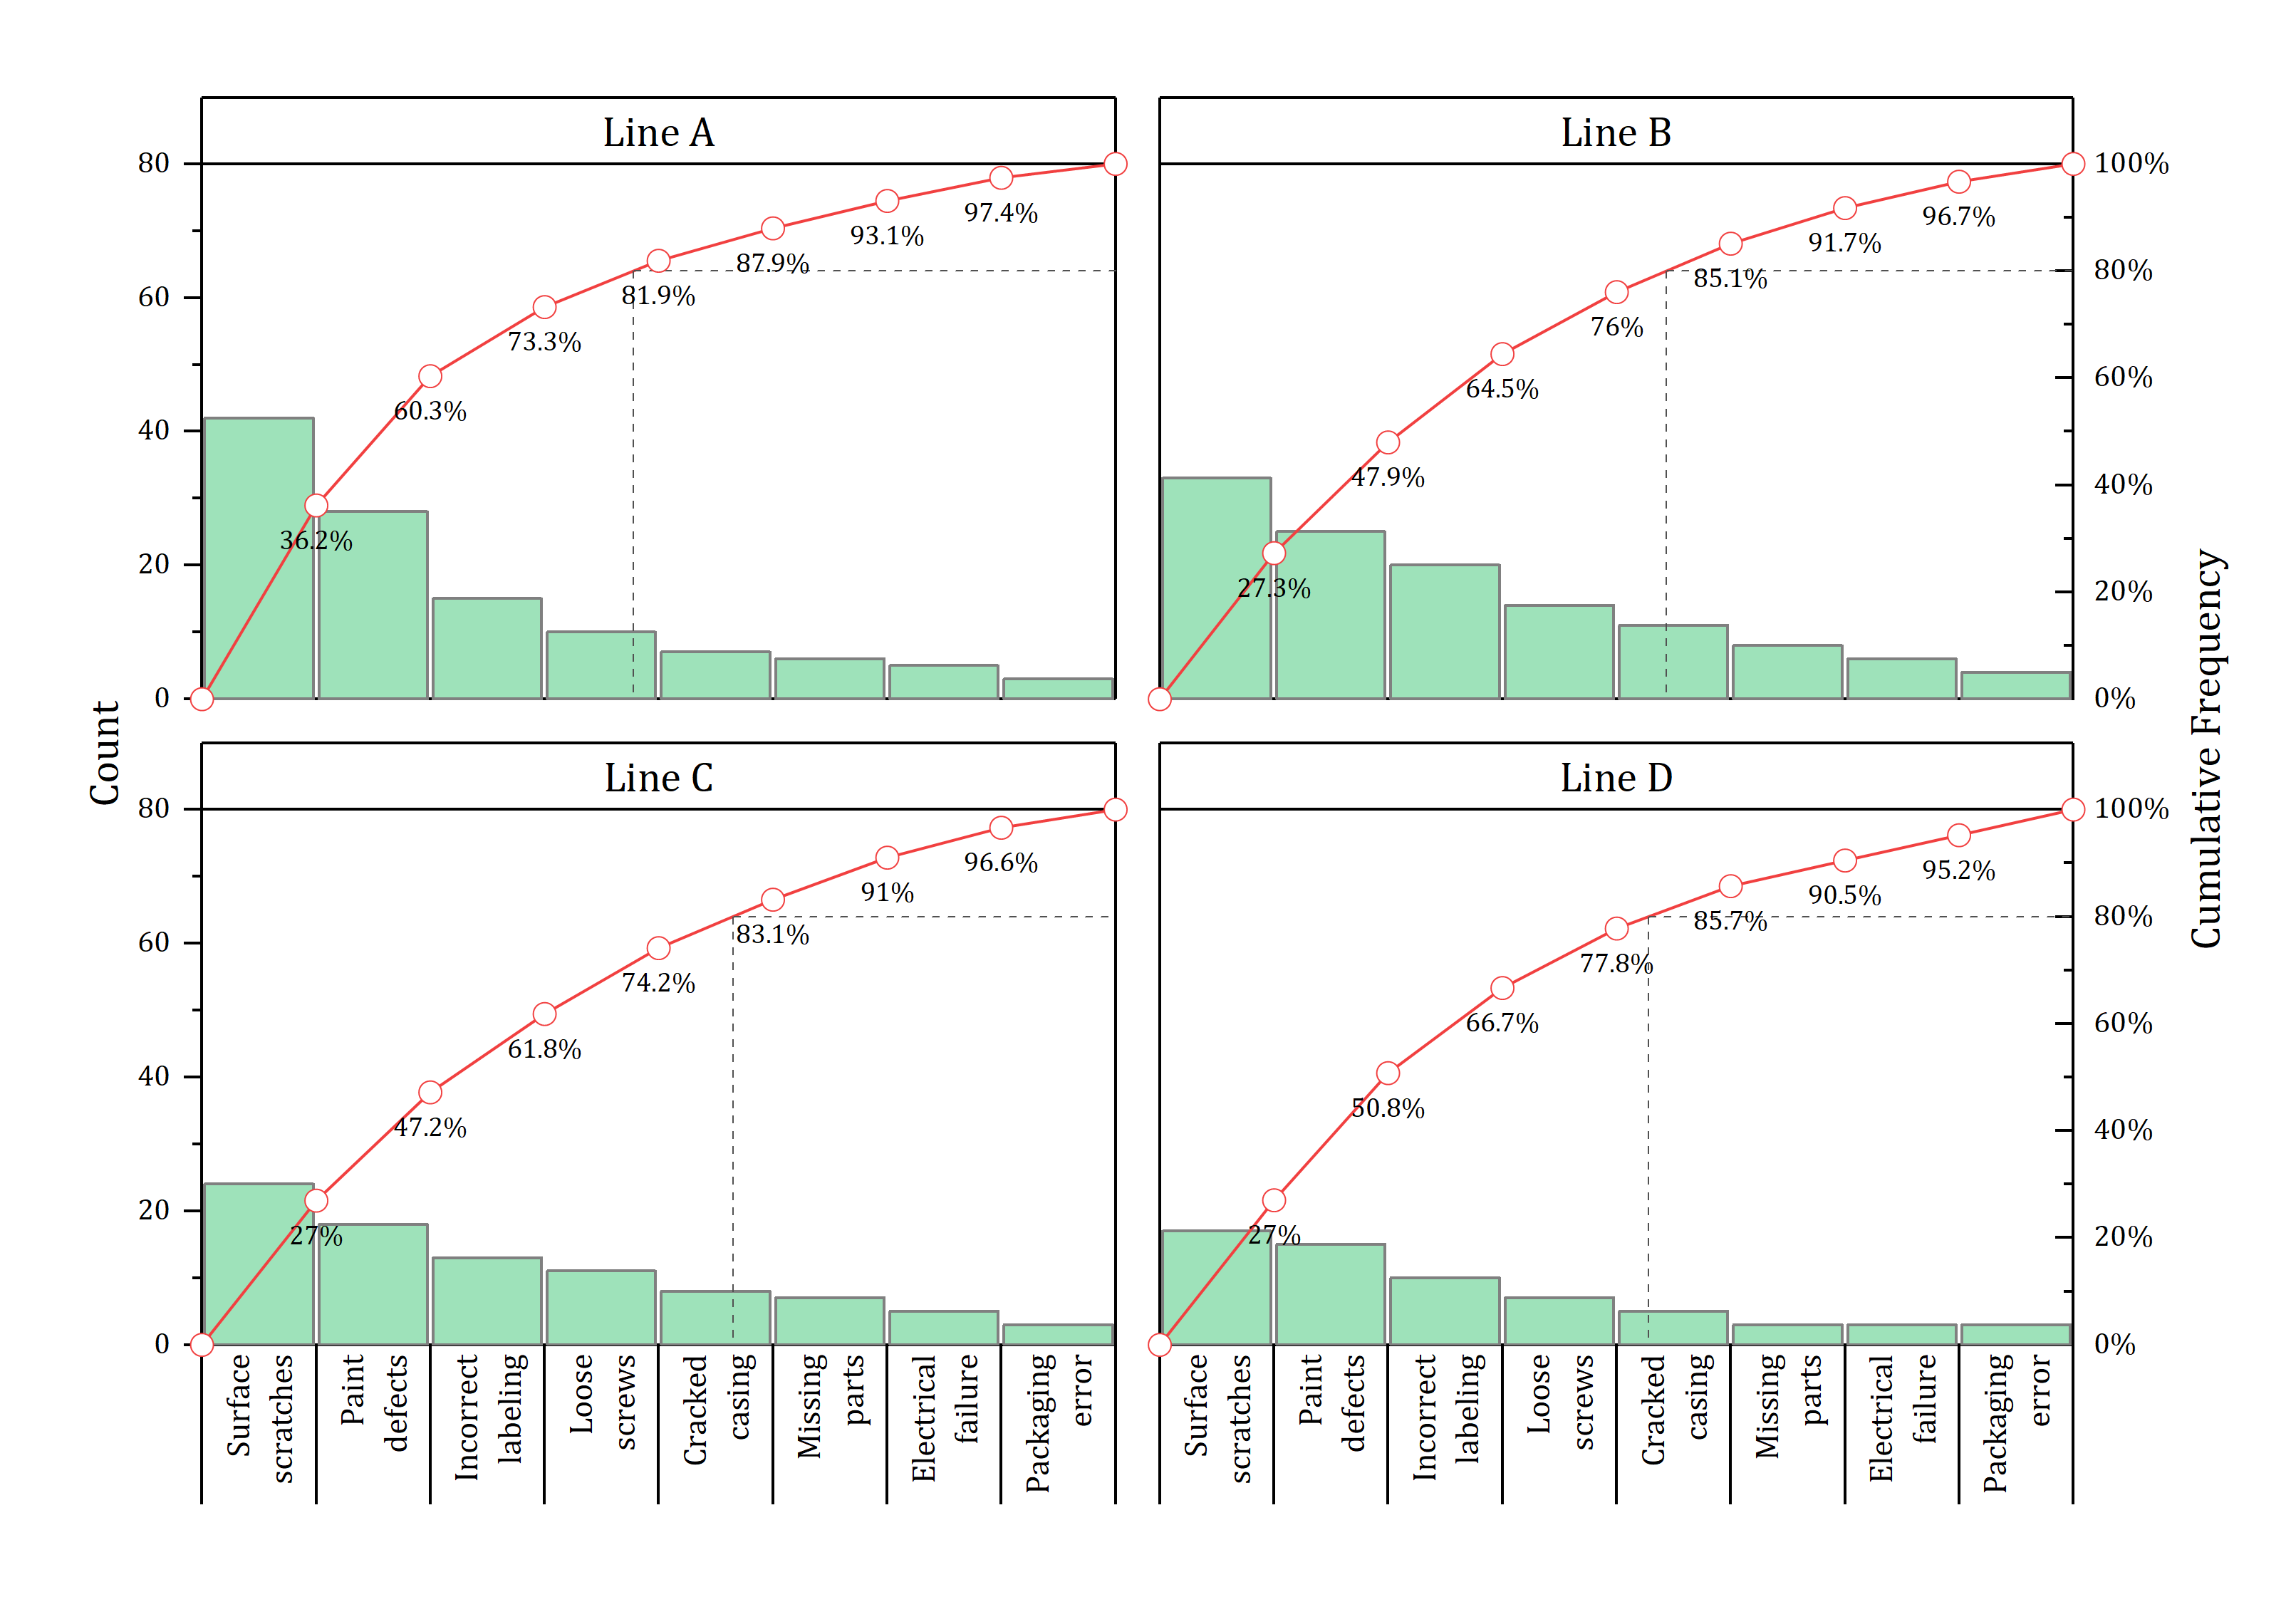
Grouped Pareto Chart
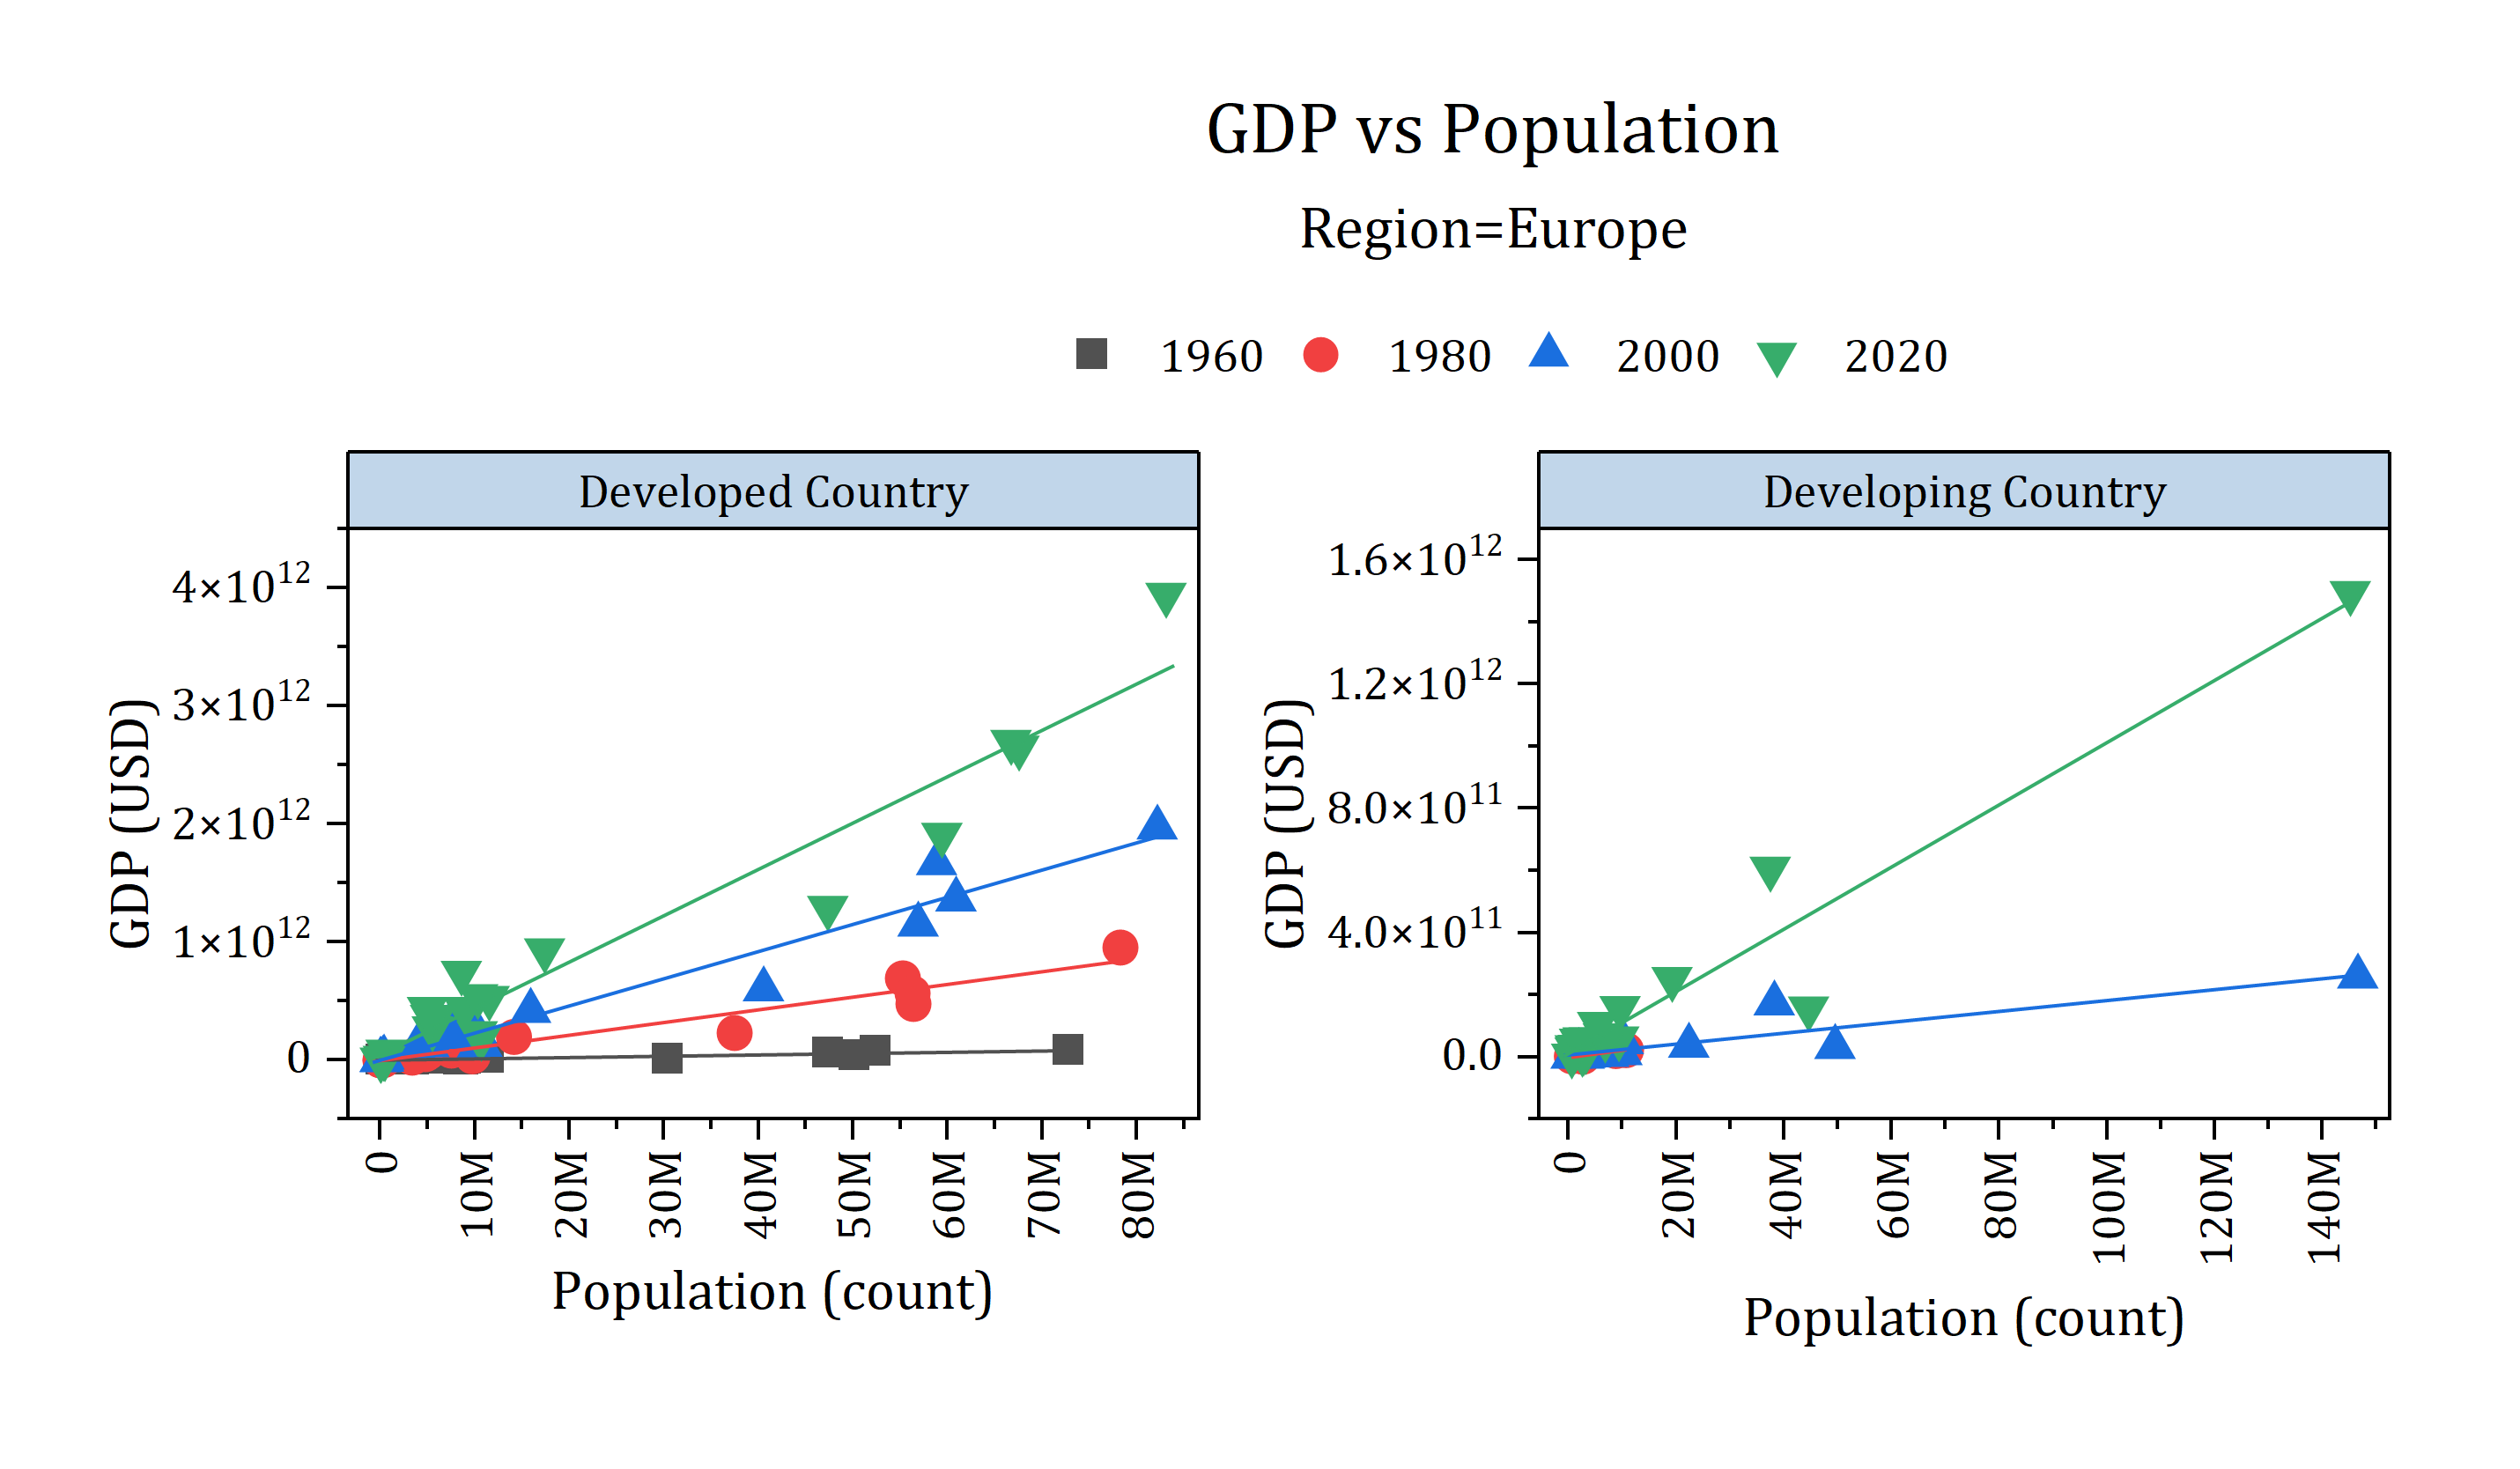
Grouped Scatter Plot
Improved Grouped Column Chart
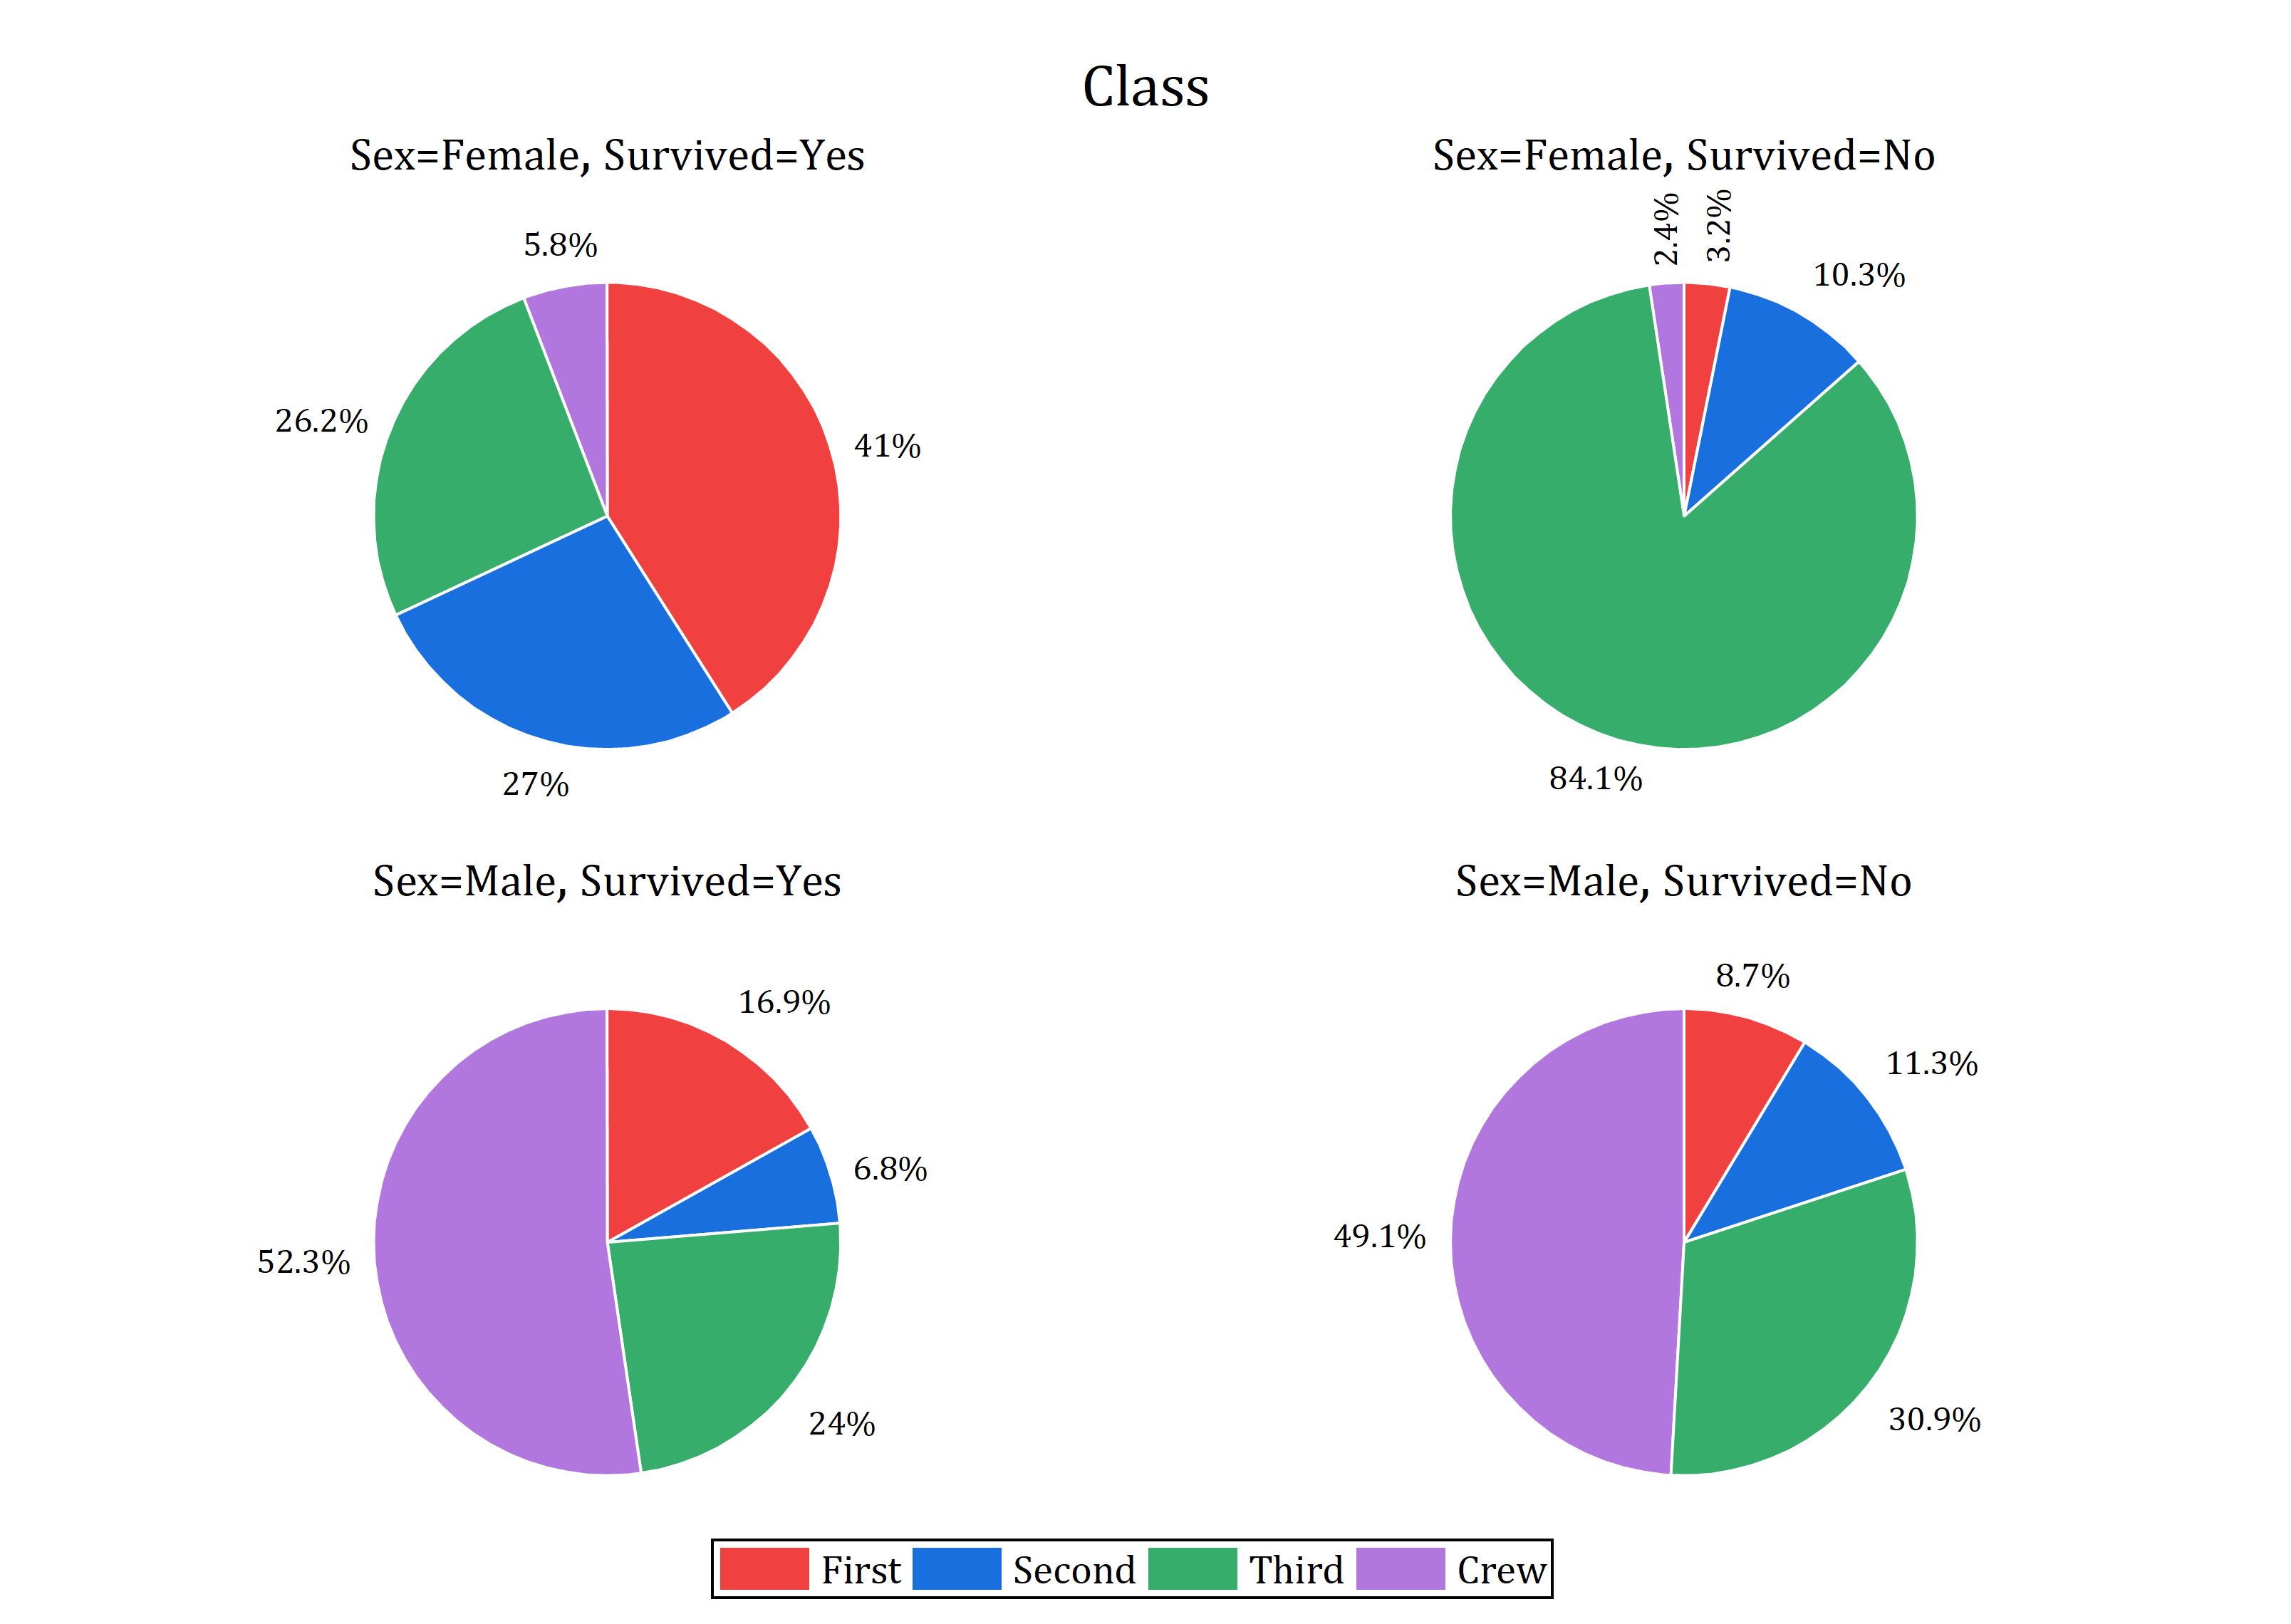
Frequency Chart: Pie
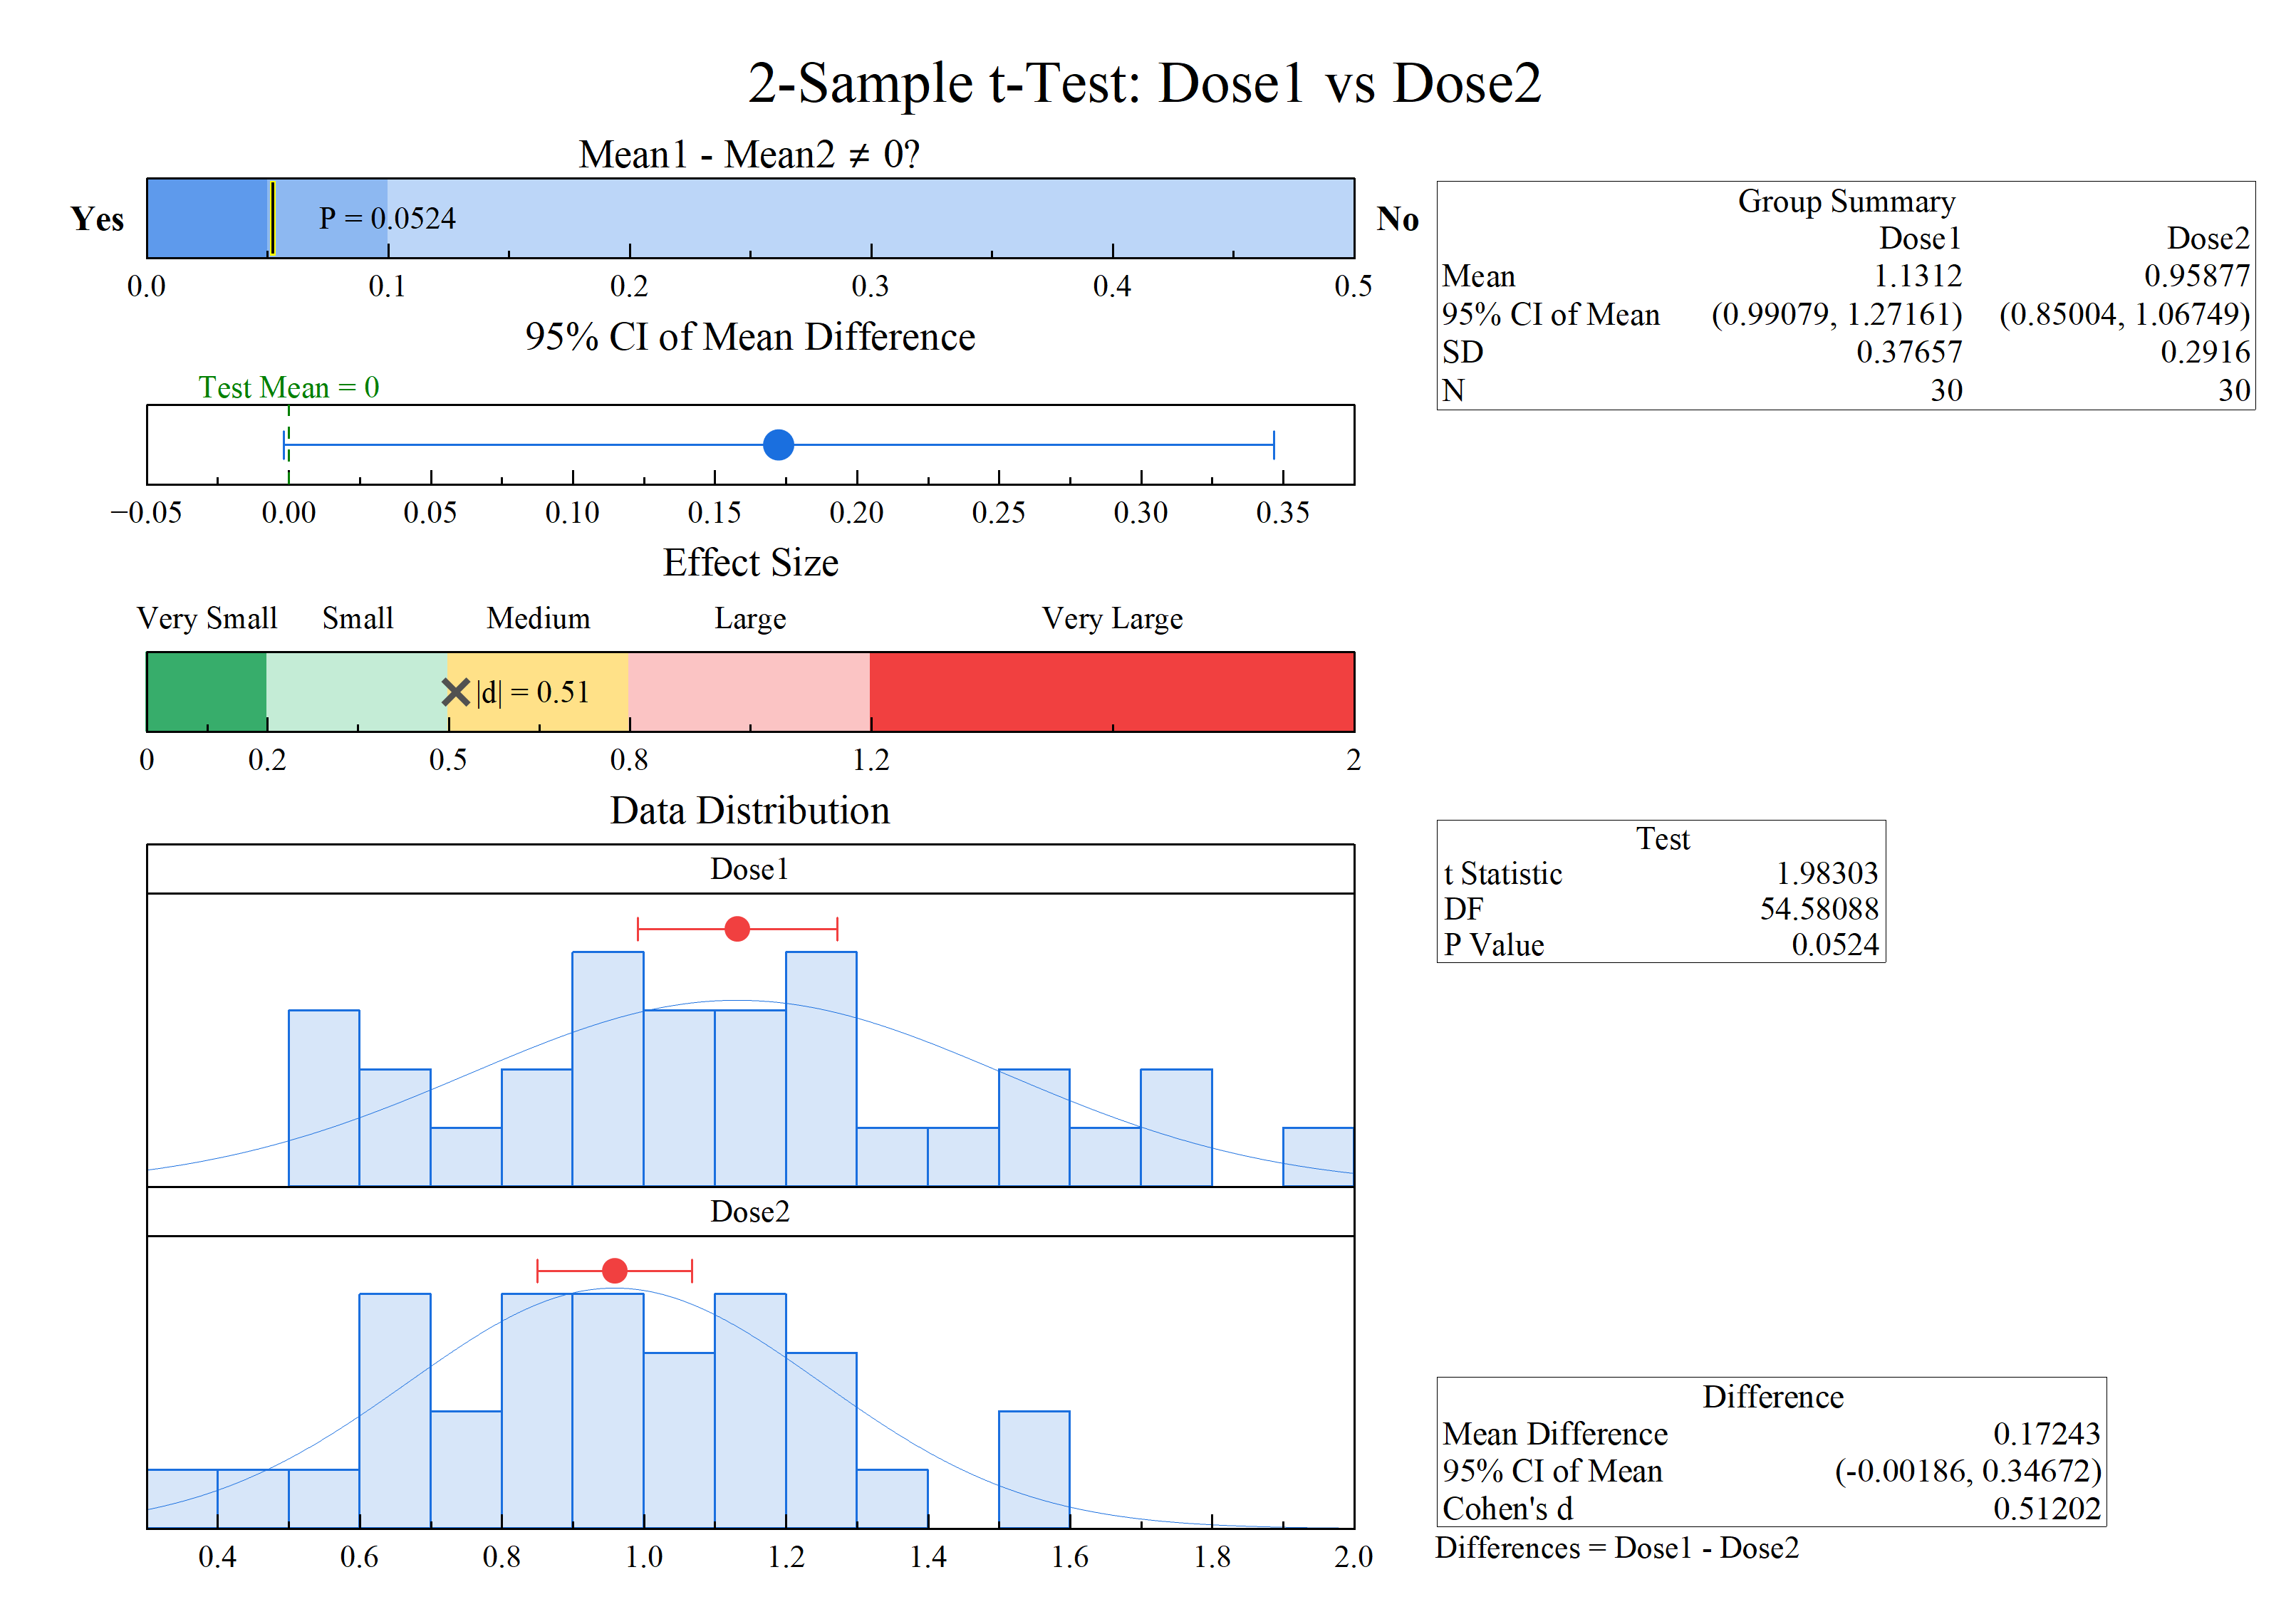
Conclusion Chart from 2-Sample t-Test
New Apps
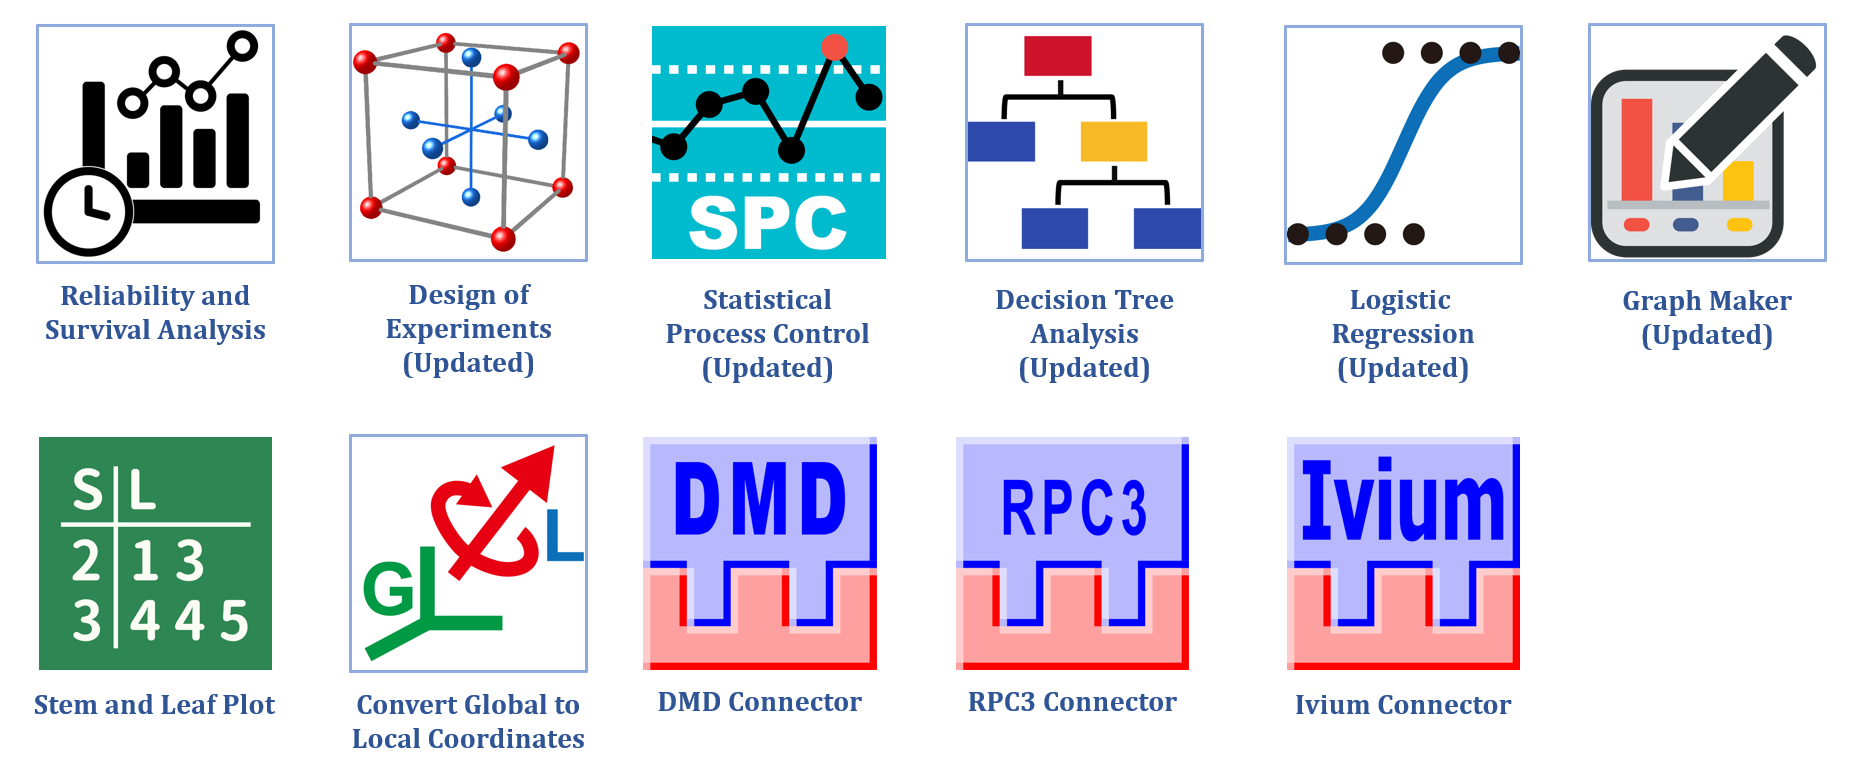
The following new/updated Apps are available with OriginPro and Origin 2026:
- Reliability and Survival Analysis PRO
- Design of Experiments (Updated) PRO
- Statistical Process Control (Updated) PRO
- Decision Tree Analysis (Updated) PRO
- Logistic Regression (Updated) PRO
- Graph Maker (Updated)
- Stem and Leaf Plot
- Convert Global to Local Coordinates
- DMD Connector
- RPC3 Connector
- Ivium Connector
- Minitab Connector (Updated)
Other Features
General
- Launch Origin or start new project with user-defined Origin.opju file
- Improved Minitab connector to import output as hierarchical sheet
- Project browser adds moving/copy windows to active folder
- Project browser to bulk edit column comments & units
- Better toolbar icons in workspace and window icons in PE
- Lock Toolbar Positions
- Show both short name and long name in Notes & Layout window title bar
Graphing
- Save and load Graph Options dialog settings
- Precise control of table font size in graph
- Mini toolbar to show/hide all legends in all layers
- Legend, Axis Title, Text and Annotation are treated as different types when select All of same type for editing
- Syntax coloring in editing legends and labels
- More Mini toolbar controls on trendlines such as label positions relative to panel/layer, trendline for group of plots, etc.
- Add significance mark for Heatmap plots
- Ctrl+Backspace to repeat last plot
- More distributions supported for Probability plot
- Custom parameter support for Histogram distribution curve
- Conclusion charts for One-Sample, Two-Sample, and Paired-Sample t-Tests
Data Handling
- Detect Unix Timestamp in XML connector
- Mini toolbar for dynamic merge and click to edit value for all cells
- Duplicate operation by specified sheets
- Sort Multiple Columns Individually
- Simplified Find (Ctrl+F) dialog based on what is displayed in sheet
- Save formula for user-defined parameter rows
- Remove all data in worksheet but keep cell formulas and links
- TRUE and FALSE support similar to Excel and Google Sheet