Gadgets in Origin and OriginPro
You can drag the ROI box to select any range of the data in the graph and view the results immediately.
When your data is plotted in a graph, Origin gadgets provide a quick and easy way to perform exploratory analysis on the graph. Perform the analysis on a specific range of the data plot by appropriately positioning a region-of-interest (ROI) object to select the desired range. The ROI object provides a fly-out menu with various options that are tailored to each specific gadget. All gadgets have a fly-out menu with a Preferences option allowing you to customize desired settings.
With Origin gadgets you can:
- Select the desired data range for analysis directly from the graph
- Get immediate visual output of results
- View updated results on screen when the ROI is moved or re-sized
- Customize the output, including appending results to a worksheet for each ROI position
- Save settings as a Theme for repeat use
A selection of the gadgets available in Origin and OriginPro are described below. Please see other sections for additional gadgets.
Cluster Gadget
Cluster Gadget (OriginPro)
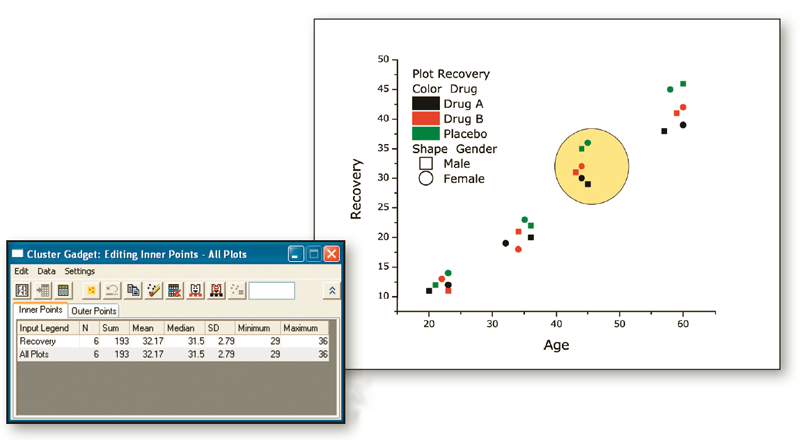
Perform basic statistics and editing of data points within a region.
The Cluster Gadget makes it convenient to perform simple statistics on a region of interest (ROI) in a graph. The gadget also allows you to easily edit the data points, such as to clear or mask points. The statistics results are dynamically updated as the ROI object is moved or resized.
Integrate, Differentiate, and Interpolate Gadgets
Integrate, Differentiate, and Interpolate Gadgets
Origin provides three gadgets for the common tasks of integration, differentiation, and interpolation of your data.
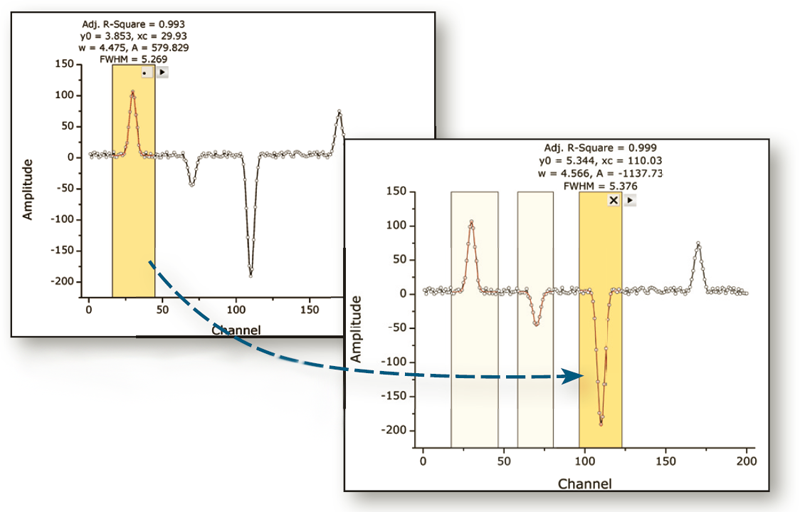
Integrate Gadget
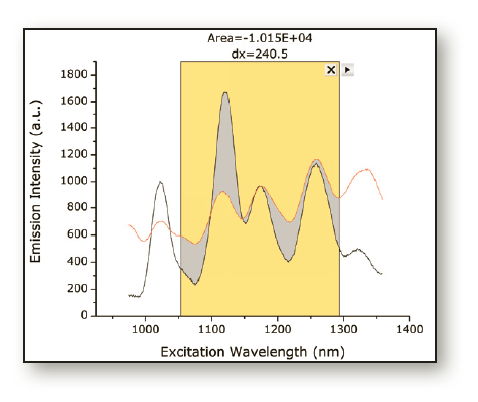
Simplifies peak area calculations.
The Integrate Gadget performs numerical integration of a data plot. You can select an arbitrary range of the data plot using the region of interest (ROI) object displayed in the graph.
With this Gadget, you can:
- Specify the integration limits
- Specify baseline
- Display the difference curve and the integral curve inside the ROI
- Calculate quantities including: peak area, peak height, peak center and FWHM
Differentiate Gadget
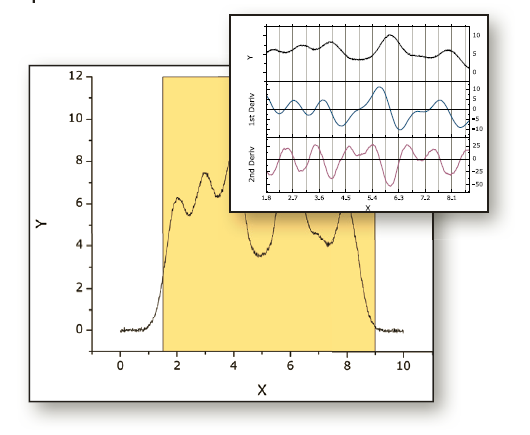
Lets you specify the desired derivative order and view the result in a separate graph.
The Differentiate Gadget provides a convenient way to calculate and display the derivative of an arbitrary region of plotted data.
With this gadget, you can:
- Move and resize the region of data to differentiate.
- Specify the desired derivative order.
- View the derivative curve alongside a graph of the data.
- Output the derivative curve to a worksheet.
Interpolate Gadget
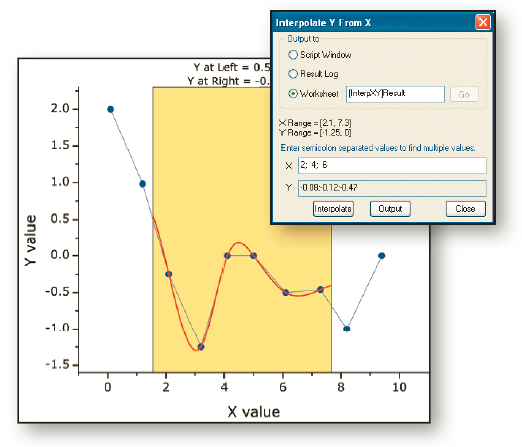
Allows easy up-or-down sampling of existing data and finding desired X/Y values.
The Interpolate Gadget allows you to perform interpolation on an arbitrary data region.
With this gadget, you can:
- Easily interpolate data points on a rectangular region with the linear, cubic spline or cubic B-spline method.
- Quickly find out an interpolated Y value from any given X value.
- Output the interpolated values to Script Window, Result Log or a specified worksheet.
Digitizer Gadget
Digitizer Gadget
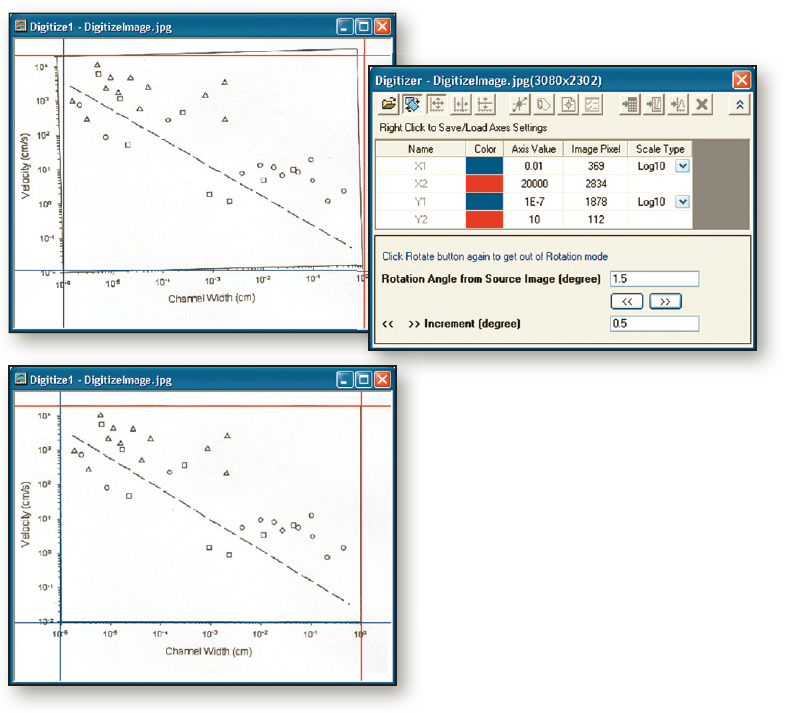
The Digitizer offers an intuitive GUI to help you quickly and easily get the values of the data points from the image. Useful features include axes references lines, image rotation, and ability to edit digitized points.
The Digitizer Gadget can extract data from images of graphs such as photocopied, faxed, or scanned images. Easily define coordinate values for the axes, and digitize multiple data curves to create an Origin worksheet and graph.
With this gadget you can:
- Digitize an image using an intuitive GUI
- Rotate image
- Define X, Y axes coordinates using movable line
- Use vertical and horizontal reference lines to check accuracy of axes coordinates
- Digitize multiple traces creating multiple data sets
- Add labels for data points
FFT Gadget
FFT Gadget
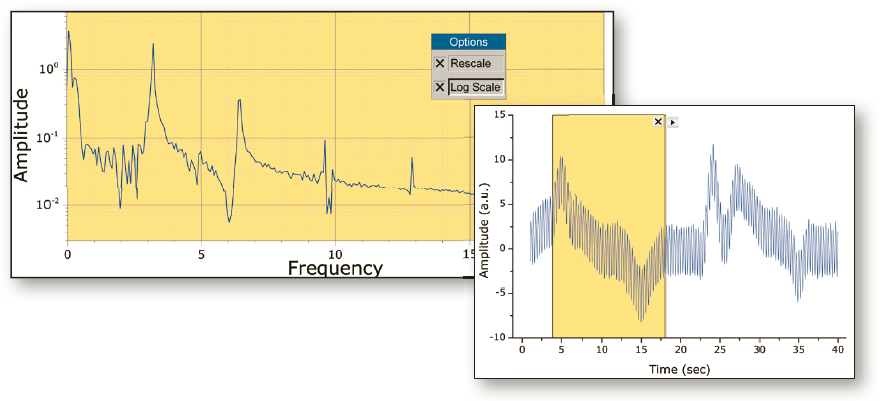
FFT Gadget
The FFT Gadget provides a simple and quick way to examine the frequency spectrum of data plotted in a graph. The frequency spectrum is displayed in a separate preview graph window, and is dynamically updated as the ROI object is moved or resized.
The Amplitude axis scale of the FFT result graph can be switched between linear and log scales.
Vertical Cursor Gadget
Vertical Cursor Gadget
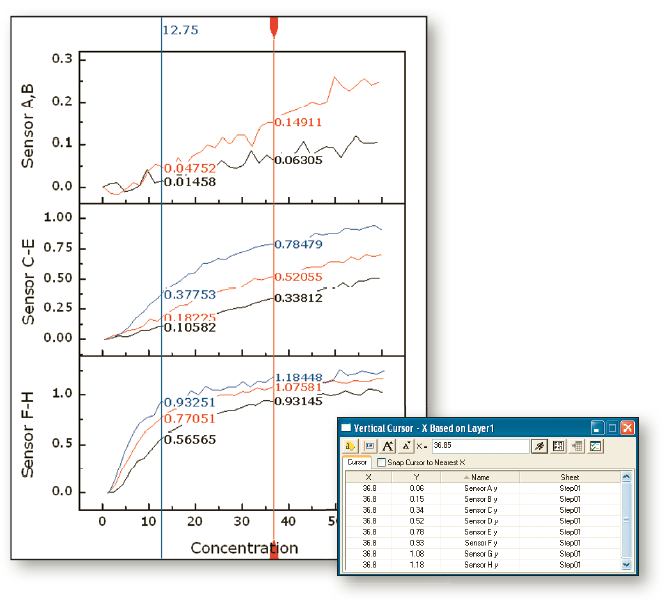
Use vertical cursor for multiple graph windows simultaneously
The Vertical Cursor Gadget provides an easy way to read X and Y coordinate values for data points on stacked panel plots and/or multiple linked graphs.
With this gadget you can:
- Link multiple graphs to read coordinates simultaneously
- Drag by the handle, or enter an X value in the dialog, to place on the reference layer
- Tag crossing points on a graph and output the XY values to a worksheet
- Add multiple tags on a graph, labeling each with a unique name
- Select the plots for which to show labels
- Snap to the nearest data point in the X direction
Intersection Gadget
Intersection Gadget
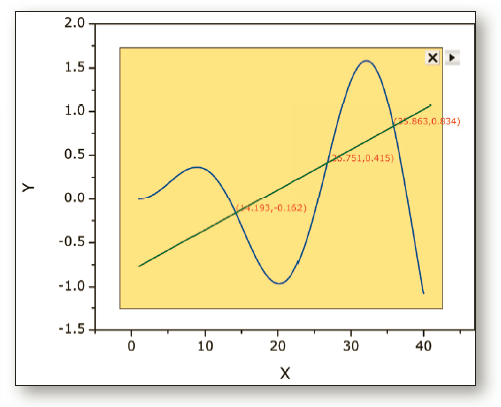
Intersection Gadget
The Intersection Gadget gives you an interactive way to calculate the intersection points of the input curves in the ROI.
With the intersection gadget you can:
- Find intersection points for more than two curves
- Tag intersection points with symbols and XY values
- Output the XY values of intersection points to a worksheet
- Change input to show intersection points on different curves
- Interpolate the input curves with a specified number of sampling