Overview of blog posts new diagram types and improvements in publishing in OriginPro and Origin 2022b
Spiral Bar Charts
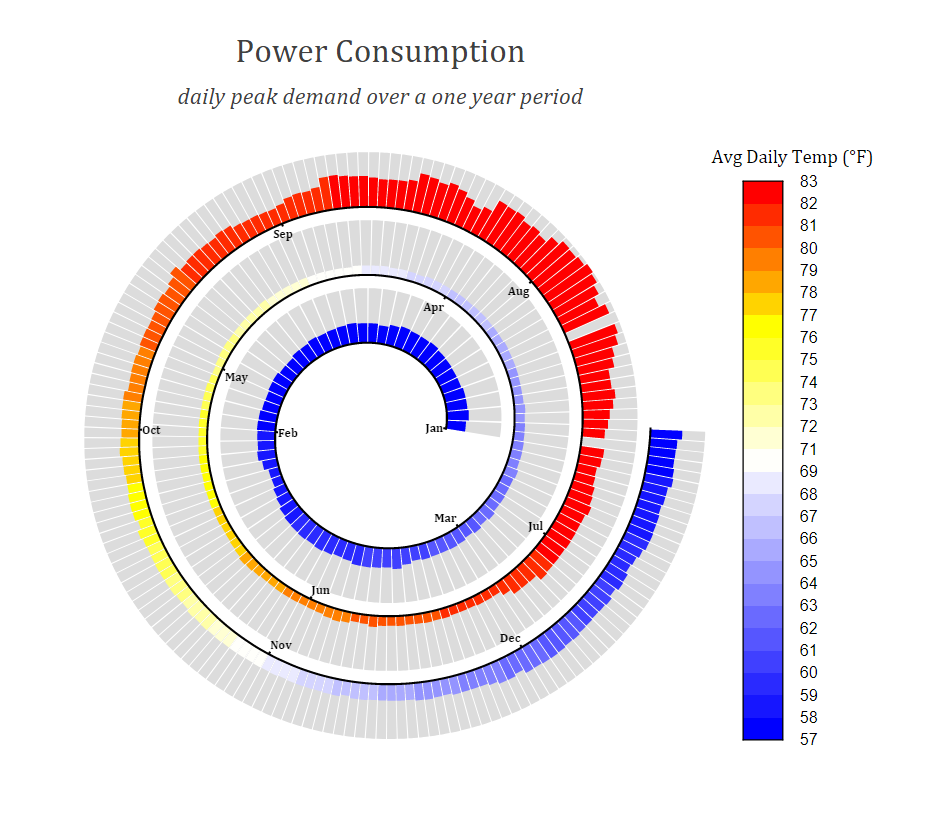
Spiral bar charts, with their compact nature and circular form, can work well for graphing trends in time-series and/or cyclical data. Spiral bar charts are newly-added for Origin and OriginPro 2022b. As with any of Origin’s many graph types, creating these plots only requires that your data be arranged in the proper form and you can generate the graph with one or two clicks.
The OriginLab blog post lists the data requirements for a spiral bar chart and shows what adjustments can be made to the chart.
Map-based “Infographic” Plots in Origin 2022b: Bar Map and Pie Map
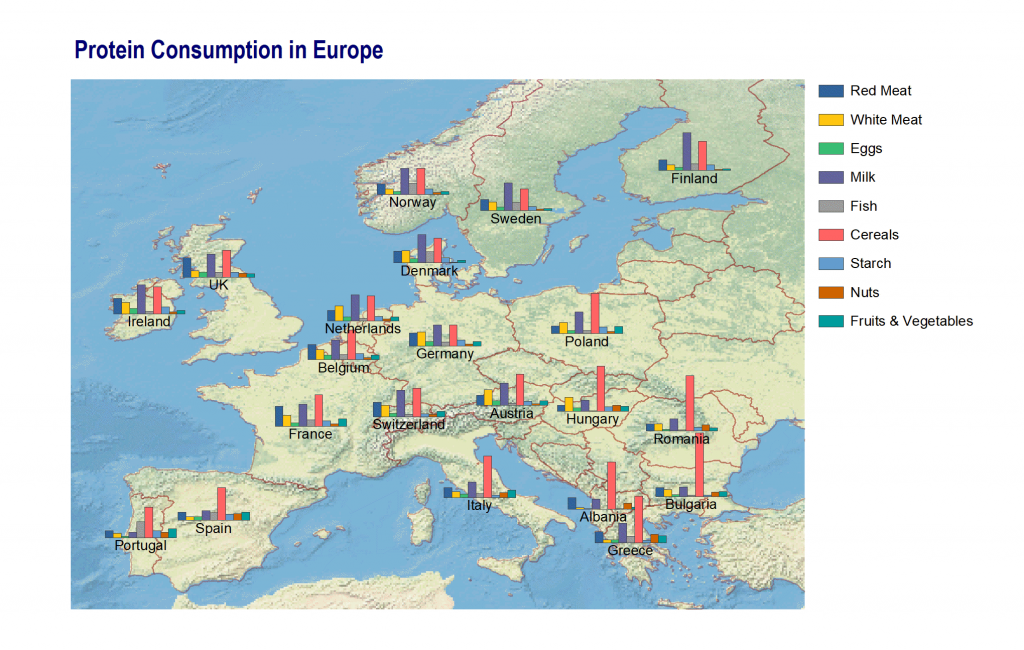
MVersion 2022b adds support for map analysis and map-based graphs in OriginPro and Origin. The new “Bar Map” graph template that plots a simple column or bar chart at user-specified geographic locations, on an easily-added map background.
The OriginLab blog post provides insight into the requirements that the data must meet in order to display data as a bar chart or pie chart on a map and explains how to insert the map background.
Notes Window with Rich Text and Style
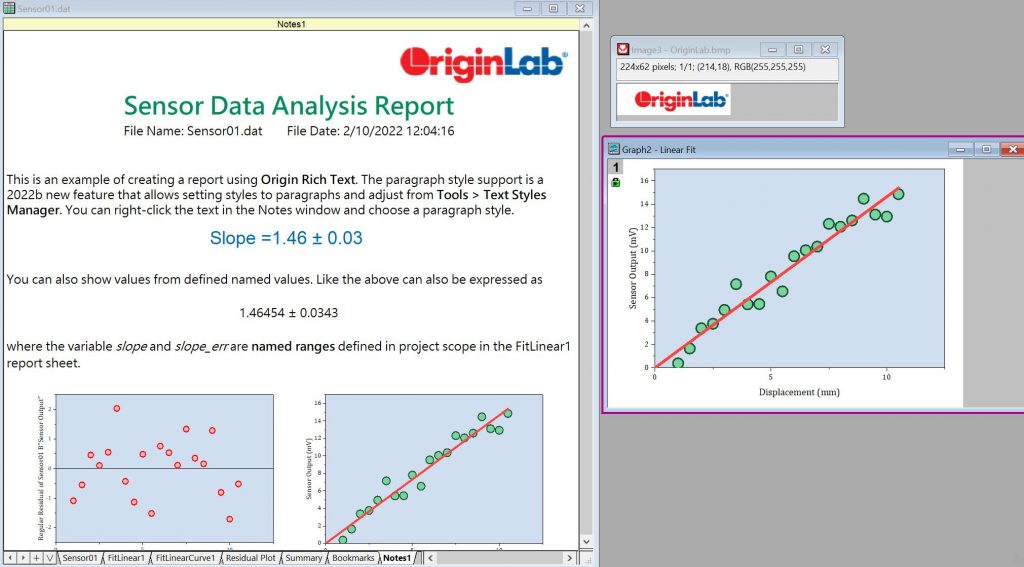
Notes window in Origin 2022b is greatly improved to support Rich Text, Image, Graph, linked Text and together with paragraph style, user can use Notes window to create a nice looking report. Such Notes window can be embedded as Notes sheet in workbook and save as an analysis template, or insert into layout or graph window. It’s also supported in cell notes.
The OriginLab blog post shows the highlights of the function and gives an overview of the different applications.