


Overview of Blog Entries for Diagrams in Origin 2019b
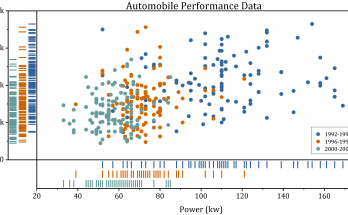
Rug Plot
A histogram is a classic way to visualize a distribution but it has its limitations and is sometimes even misleading. A Rug Plot would be another way to display a distribution as an adjunct to your primary plot. A Rug Plot is simply a projection of raw data points onto a particular axis, without involving the binning process of a histogram.
Read more at the OriginLab Blog »
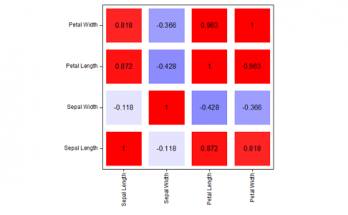
Heatmap Improvements in Origin 2019b
In Origin 2019b, several improvements for heatmap graph were implemented. Also the Plot menu was reaorganized so all heatmap types are under "Plot > Contour" now..
Read more at the OriginLab Blog »
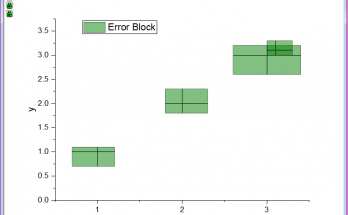
Plot x and y Error Bar as Rectangular Box
User has x, y data with x errors and y errors and wants to display the errors as rectangular boxes in the graph. This type of plot can be realized using Floating column plot.