What's New in OriginPro 2020b and Origin 2020b
OriginPro and Origin 2020b offer the following new features::
- New Mini Toolbars for Worksheets and Matrixsheets
- Mini Toolbar Additions for Graphs
- Browser Graph for Multichannel Data Exploration
- Data Connector Improvements
- Improved Graph Customization
- New Graph Types
- Correlation Plot
- Neue Apps
- Weitere Funktionen
New Mini Toolbars for Worksheets and Matrixsheets
- Quick access to common operations on cell, column, row and worksheet
- Toggle display of cell formula, categorical index, column list view, or worksheet organizer
- Toggle matrix view, image slider, or X/Y coordinates
- Mask selected data range or copy to paste into a graph
- Customize Mini Toolbars by adding/removing buttons
Mini Toolbar Additions for Graphs
New Mini toolbar buttons have been added for graphs in OriginPro and Origin 2020b:
- Fit page to layers, and window view toggle
- Show, hide, add plots in layer, and rescale to show all
- Add Statistics Reference Lines for plots in layer
- Wrap Text button for label, legend, axis title and tick labels
- More axis break customizations such as style, length, etc.
- More buttons for plot types, such as fill area for area plot
- Single point and single label customization
- Graphic object and multi-object customization
- More options in Mini Axis dialogs
- Customize Mini Toolbars by adding or removing buttons
Browser Graph for Multichannel Data Exploration
OriginPro and Origin 2020b introduce a set of Browser Graph templates that allow for quick and easy exploration of multi-column data:
- Allow quick selection of columns to plot, such as by picking every Nth column
- Choice of line and histogram plots
- Interactively turn selected plots on/off to explore
- Sort plots using any metadata value
- Options to add data from current sheet or other sheets or books
Data Connector Improvements
Several additons and improvements have been implemented for Data Connectors in OriginPro and Origin 2020b:
- Data Navigator panel added to worksheet to view and change subset of data to be imported, for instance when importing multi-sheet Excel files
- Improvements to CSV Connector for auto-detecting date/time and data blocks
- New Database Connector dialog allows use of connection string, an existing ODBC datasource, a custom ODBC connection w/o datasource or an OLE DB connection.
- Improved MATLAB™, HDF and NetCDF Data Connectors
- Several new connectors for other file formats (Please see section "Apps")
Improved Graph Customization
In OriginPro and Origin 2020b, several new options and improvements have been added for graph customization:
- Copy data for plotting Mini Toolbar button
- Wrap Text in Legend, Axis Title, Text Labels
- Curve Tool for creating editable freehand curved objects
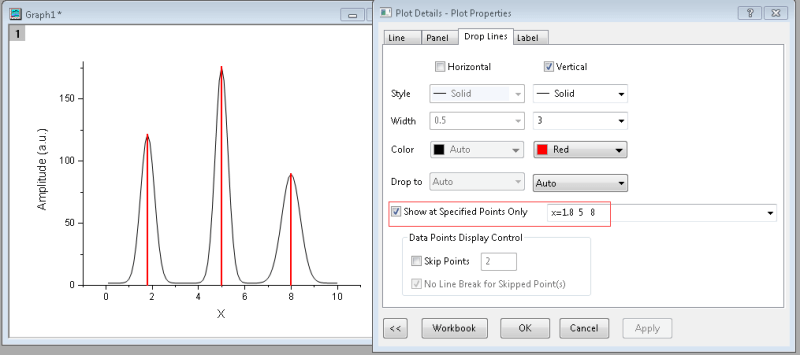
- Droplines at specified points only
- Connected line, symbol and dropline in 2D and 3D column/bar plot
- Data Highlighting in 3D graph
- Box chart improvements
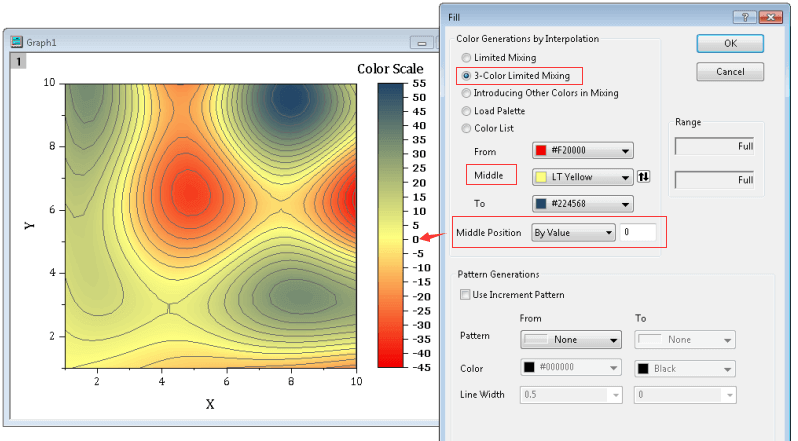
- Middle level control in 3-color mixing of Colormap
- Reverse plots in layer in Object Manager
- More axis break styles
- Skew Plots with adjusted Angles between Axes
- Symmetrical Positive and Negative Log Scale
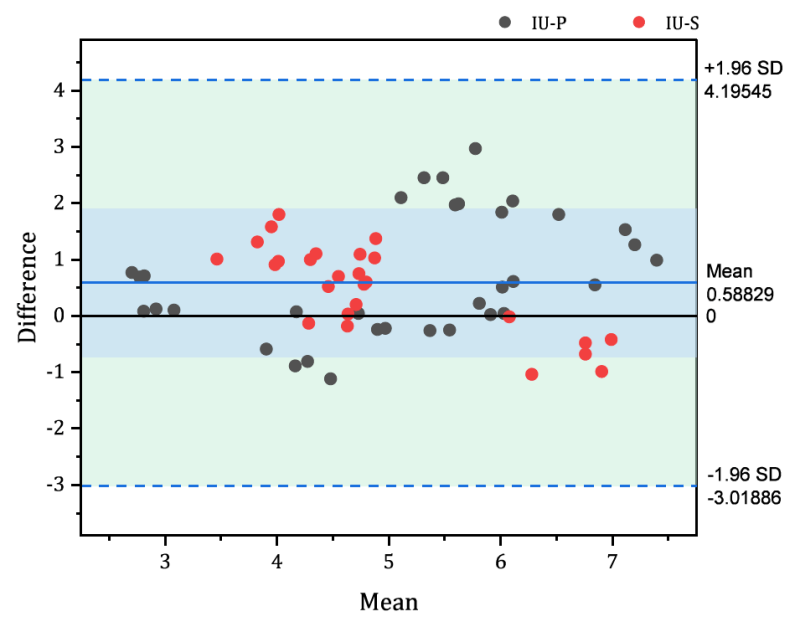
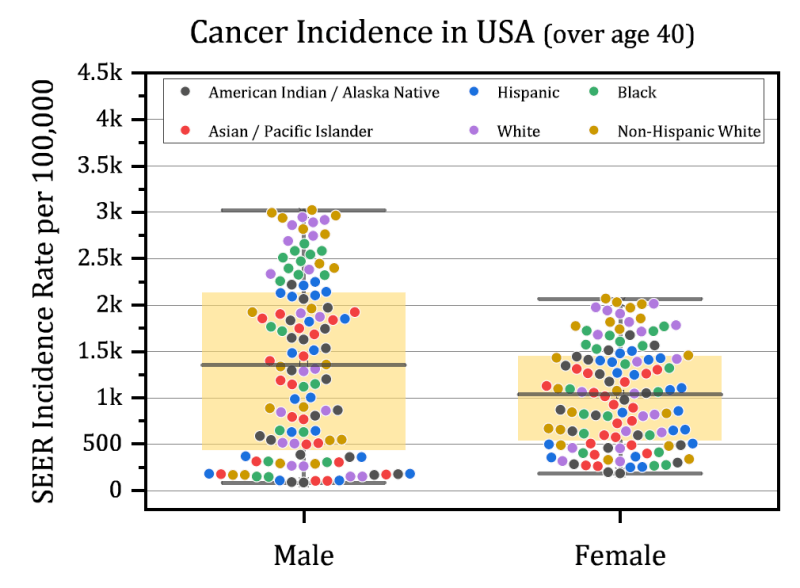
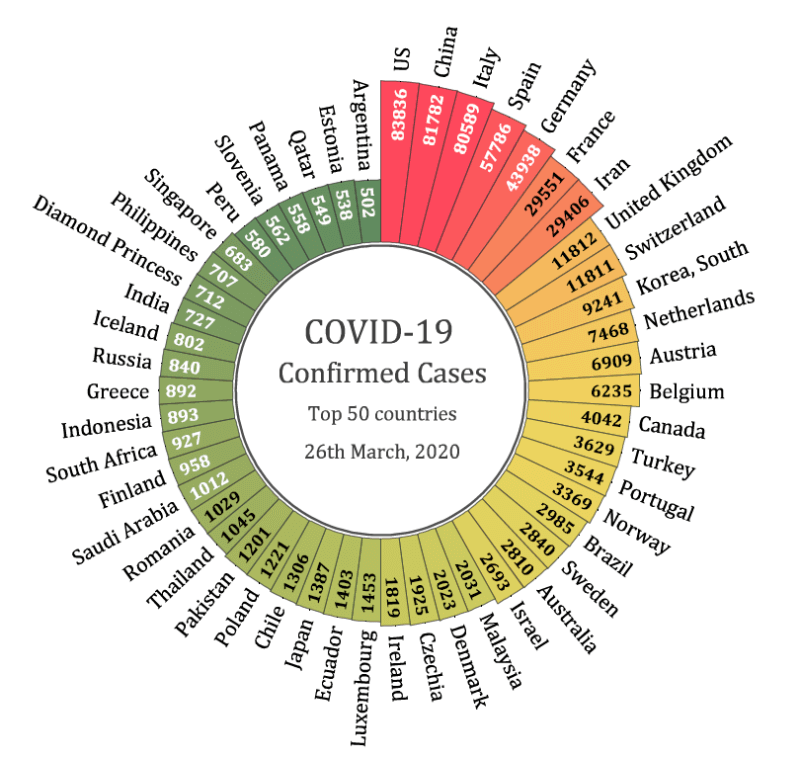
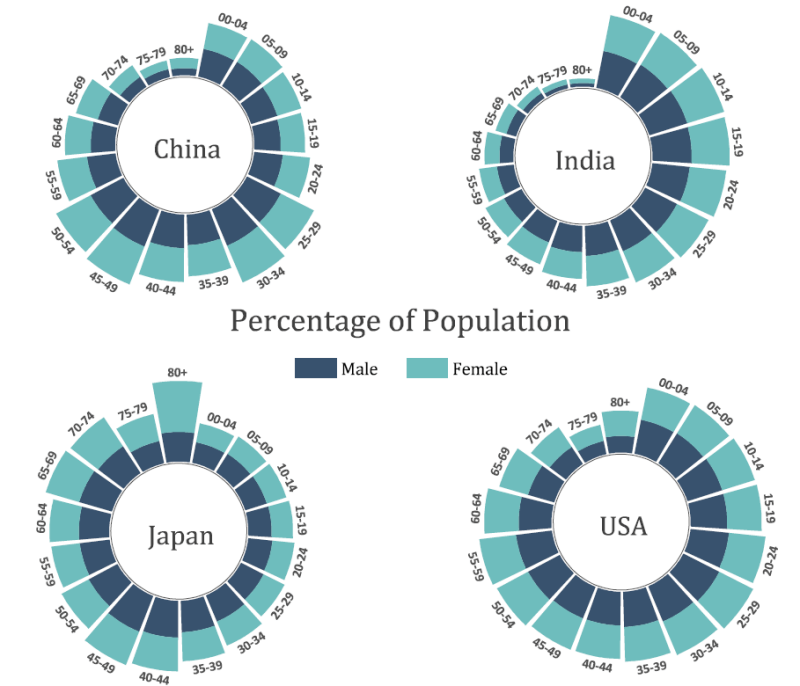
New Graph Types
The following new graph types have been added in OriginPro and Origin 2020b:
- Bland-Altman Plot
- Beeswarm Plot
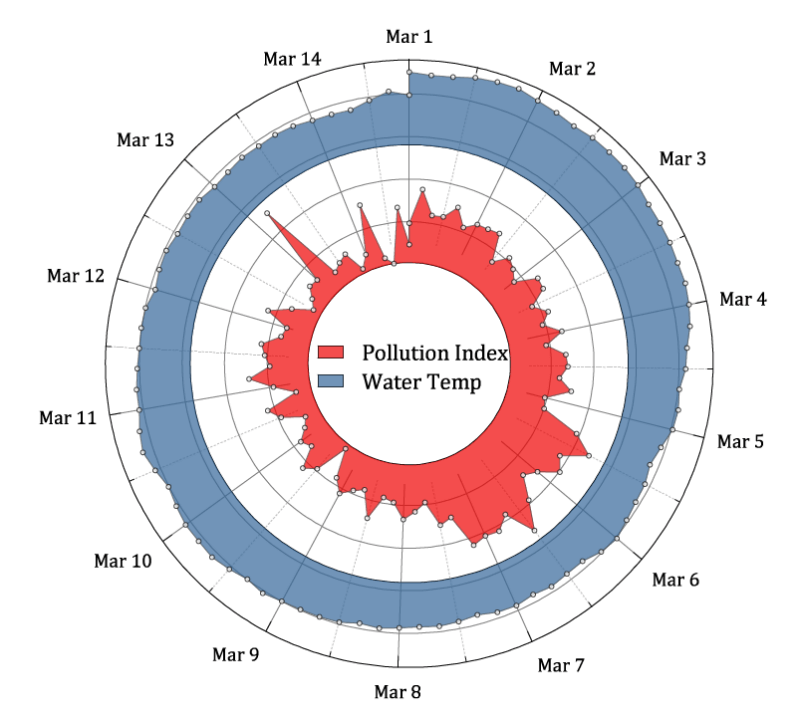
- Radial Lines and Bars
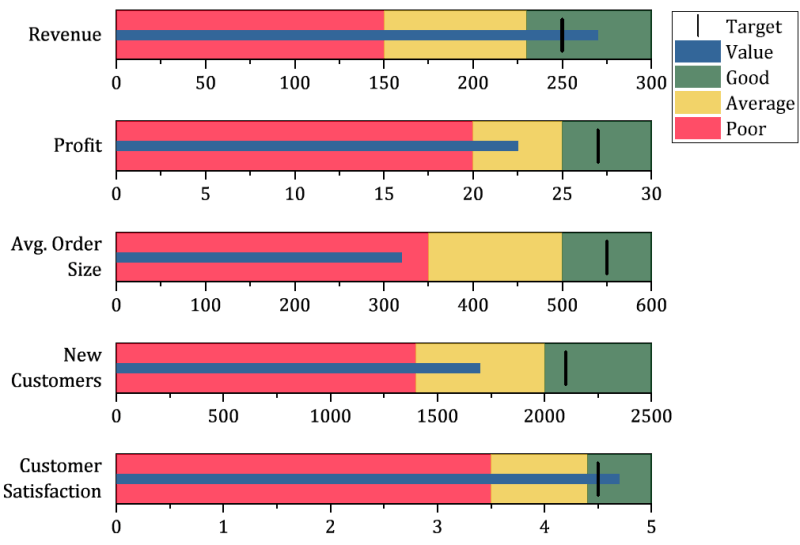
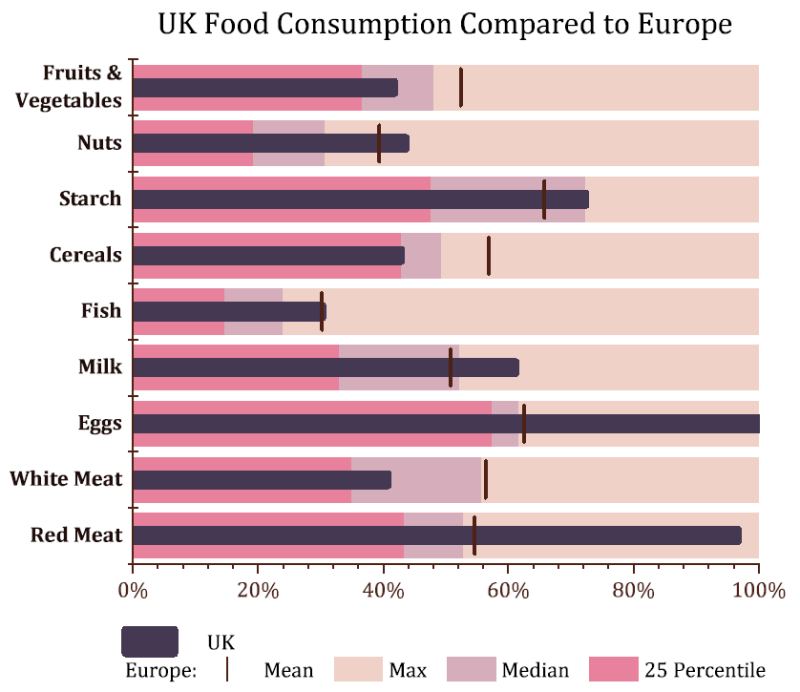
- Bullet Chart: Vertical, Horizontal and Normalized
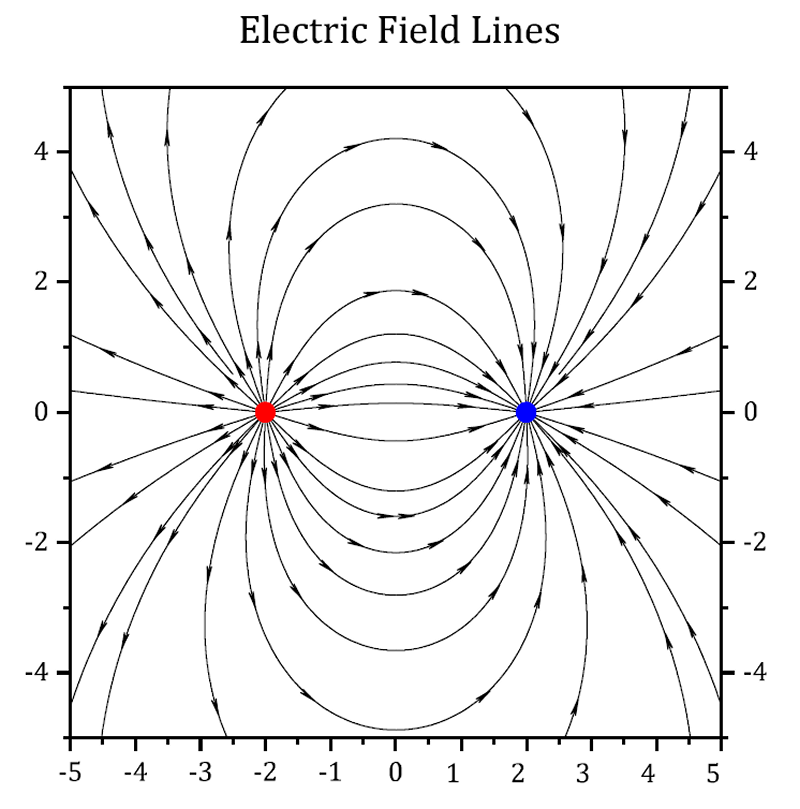
- Streamline Plot
- 3D XYY "Side by Side" Bar Chart
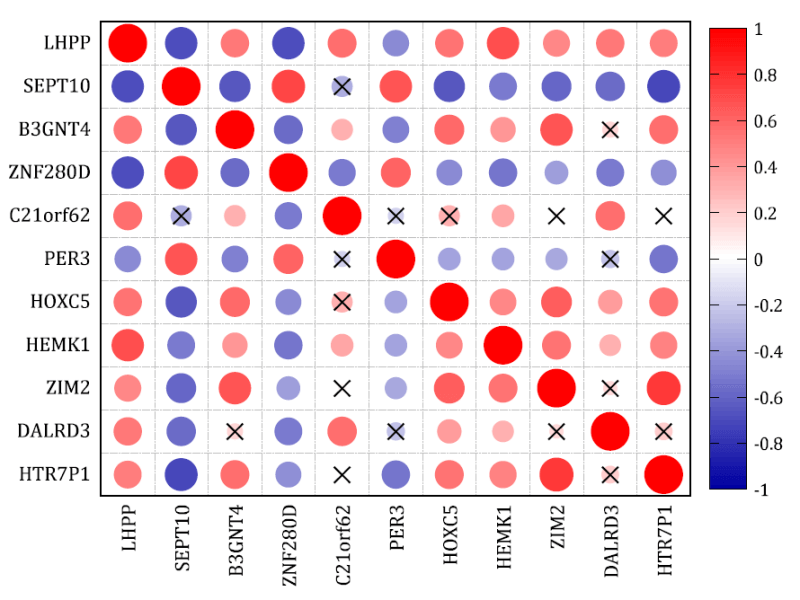
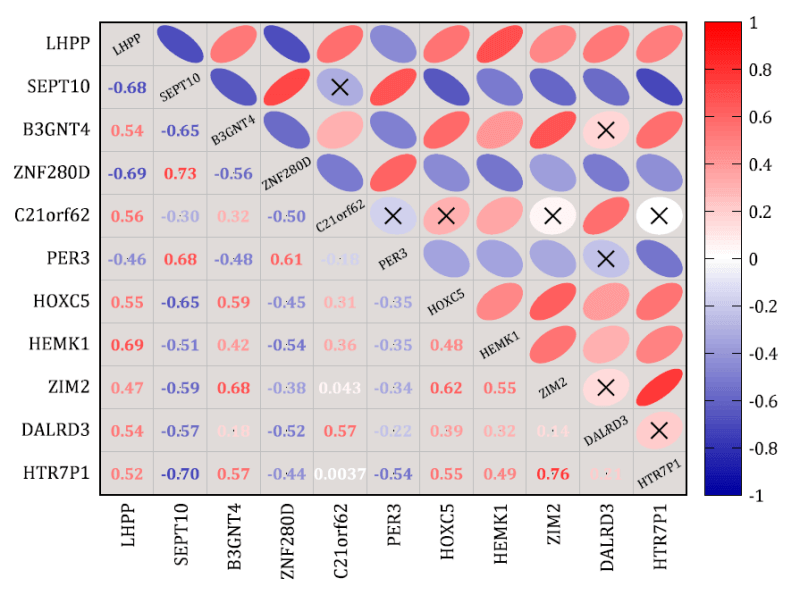
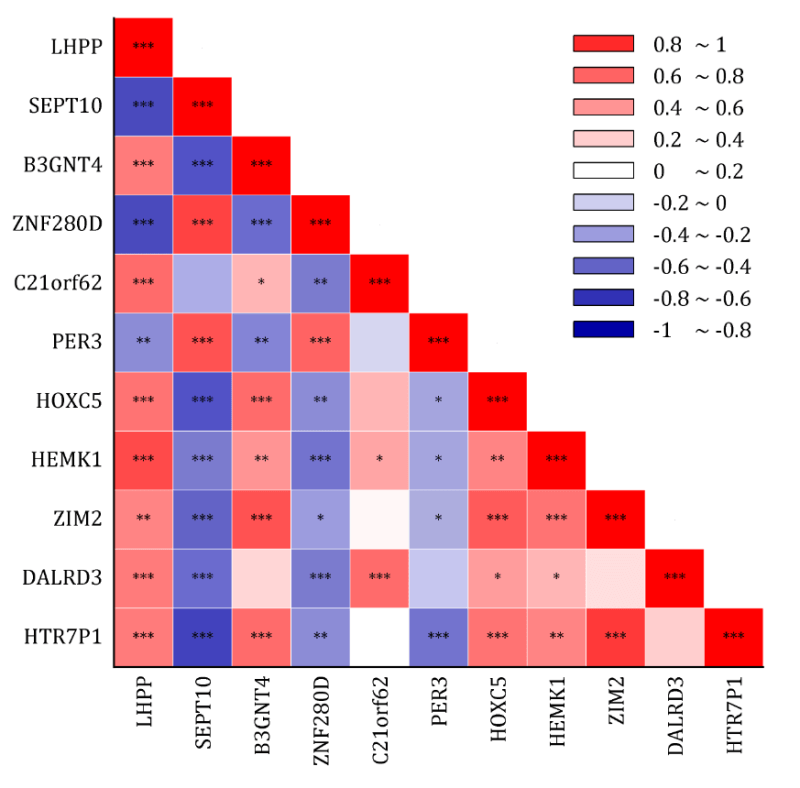
Correlation Plot
The new Correlation Plot App introduced in OriginPro and Origin 2020b allows several variations to display correlation coefficients:
- Scatter vs. Heatmap vs Ellipse
- Upper vs Lower Triangular vs Square configuration
- Flexible Labels:
- Significance Mark
- Insignificant Mark
- Correlation Coefficient
- p Value
New Apps
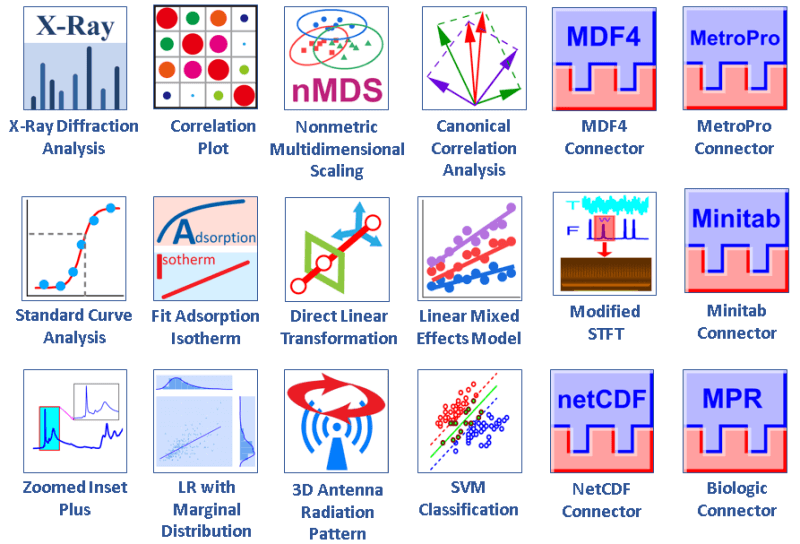
The following new Apps are available with OriginPro and Origin 2020b. Several Data Connector Apps that are shipped with the product have also been improved and updated.
- 3D Antenna Radiation Pattern PRO
- BioLogic Connector
- Canonical Correlation Analysis PRO
- Correlation Plot PRO
- Direct Linear Transformation PRO
- Fit Adsorption Isotherm PRO
- Linear Mixed Effects Model PRO
- Linear Regression with Marginal Distribution PRO
- MDF4 Connector
- MetroPro Connector
- Minitab Connector
- Modified Short-Time Fourier Transform PRO
- NetCDF Connector
- Nonmetric Multidimensional Scaling PRO
- Standard Curve Analysis PRO
- SVM Classification PRO
- X-Ray Diffraction Analysis PRO
- Zoomed Inset Plus
Other Features
General
- Better display of cell contents
- Allow up to 799 characters in Text cell (increased from 252 in previous versions)
- File: Project Properties dialog to save decimal separator info. in project file
- Change X or Y of plot to column from other worksheet
- Easy way to go to corresponding graph from result sheet
- Allow MATLAB Console to connect to already running instance of MATLAB
- Copy entire hierarchical sheet as HTML
- Copy EMF image in cell and paste into other applications
Data Manipulation
- Text2Cols X-Function to Split Text Cell with separator to Columns
- Remove/Combine Duplicated Rows with multiple reference columns and duplication tolerance
- Split worksheet by reference column value change, direction change and direction reset
- Output Data source in Append worksheets result
- Join Worksheet by Column and Label improvements
- Shrink matrix with more statistics
- Speed up unstacking columns
Analysis
- Peak Analyzer improvements such as filter peaks by script, sort peaks in peak properties sheet, etc.
- Batch PA improvements such as faster speed, recalculation option, sort peaks, better message when fit fails, etc.
- Output Gadget results to source data workbook
- Multiple Dataset Identifier in analysis result
- Reprocess and Update button on Batch Processing summary sheet
- Add EC90 and EC10 output for built-in functions and Sigmoidal gadget
- Statsxy X-Function to get statistics by binning
- Mean Comparison in 3 Nonparametric analysis tools
Sem()function to calculate standard error of dataset