


Overview of Blog Entries for Diagrams in OriginPro and Origin 2021
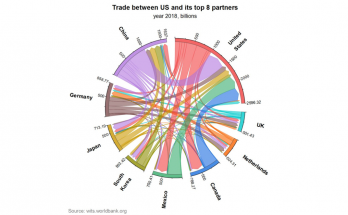
Chord Diagram in OriginPro and Origin 2021
Chord Chart is a visualization method of displaying the relationship or trans-flows among different items. The data will be arranged around a circle and the relationships between them will be plotted as arcs.
Read more at the OriginLab Blog
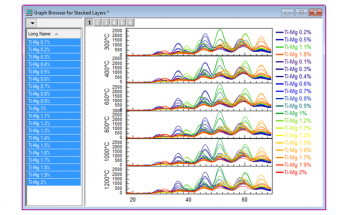
Browser Graph Improvements in OriginPro and Origin 2021
Origin 2021 brings several improvements to our popular Browser Graph feature. These improvements include:
- A Browser Graph mini toolbar button to convert a normal graph to a Browser Graph and vice versa.
- A Flip Through navigation tool.
- A new Stack Browser Graph.
Read more at the OriginLab Blog
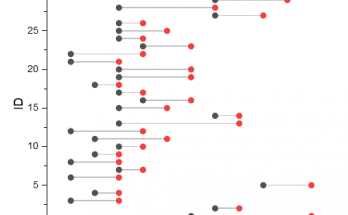
Lollipop Plot in OriginPro and Origin 2021
Origin 2021 introduces the lollipop plot which is useful to compare numeric values in two or more groups/categories.