Plotting a Trellis Plot with Double Y Axis in Origin 2019
Trellis Plots provide a way to graph multivariate data in a multi-panel format. If your column/columns are filled with categorical data, a trellis plot might be useful for a means of plotting your data.
New to Origin 2019, is the capability to plot a Trellis Plot with a Double Y-Axis. To plot this graph, first download Double Y Trellis sample data from the OriginLab website by clicking on the link. Next unzip the downloaded file and open the .opju file named 'Trellis DoubleY Plot.opju'.
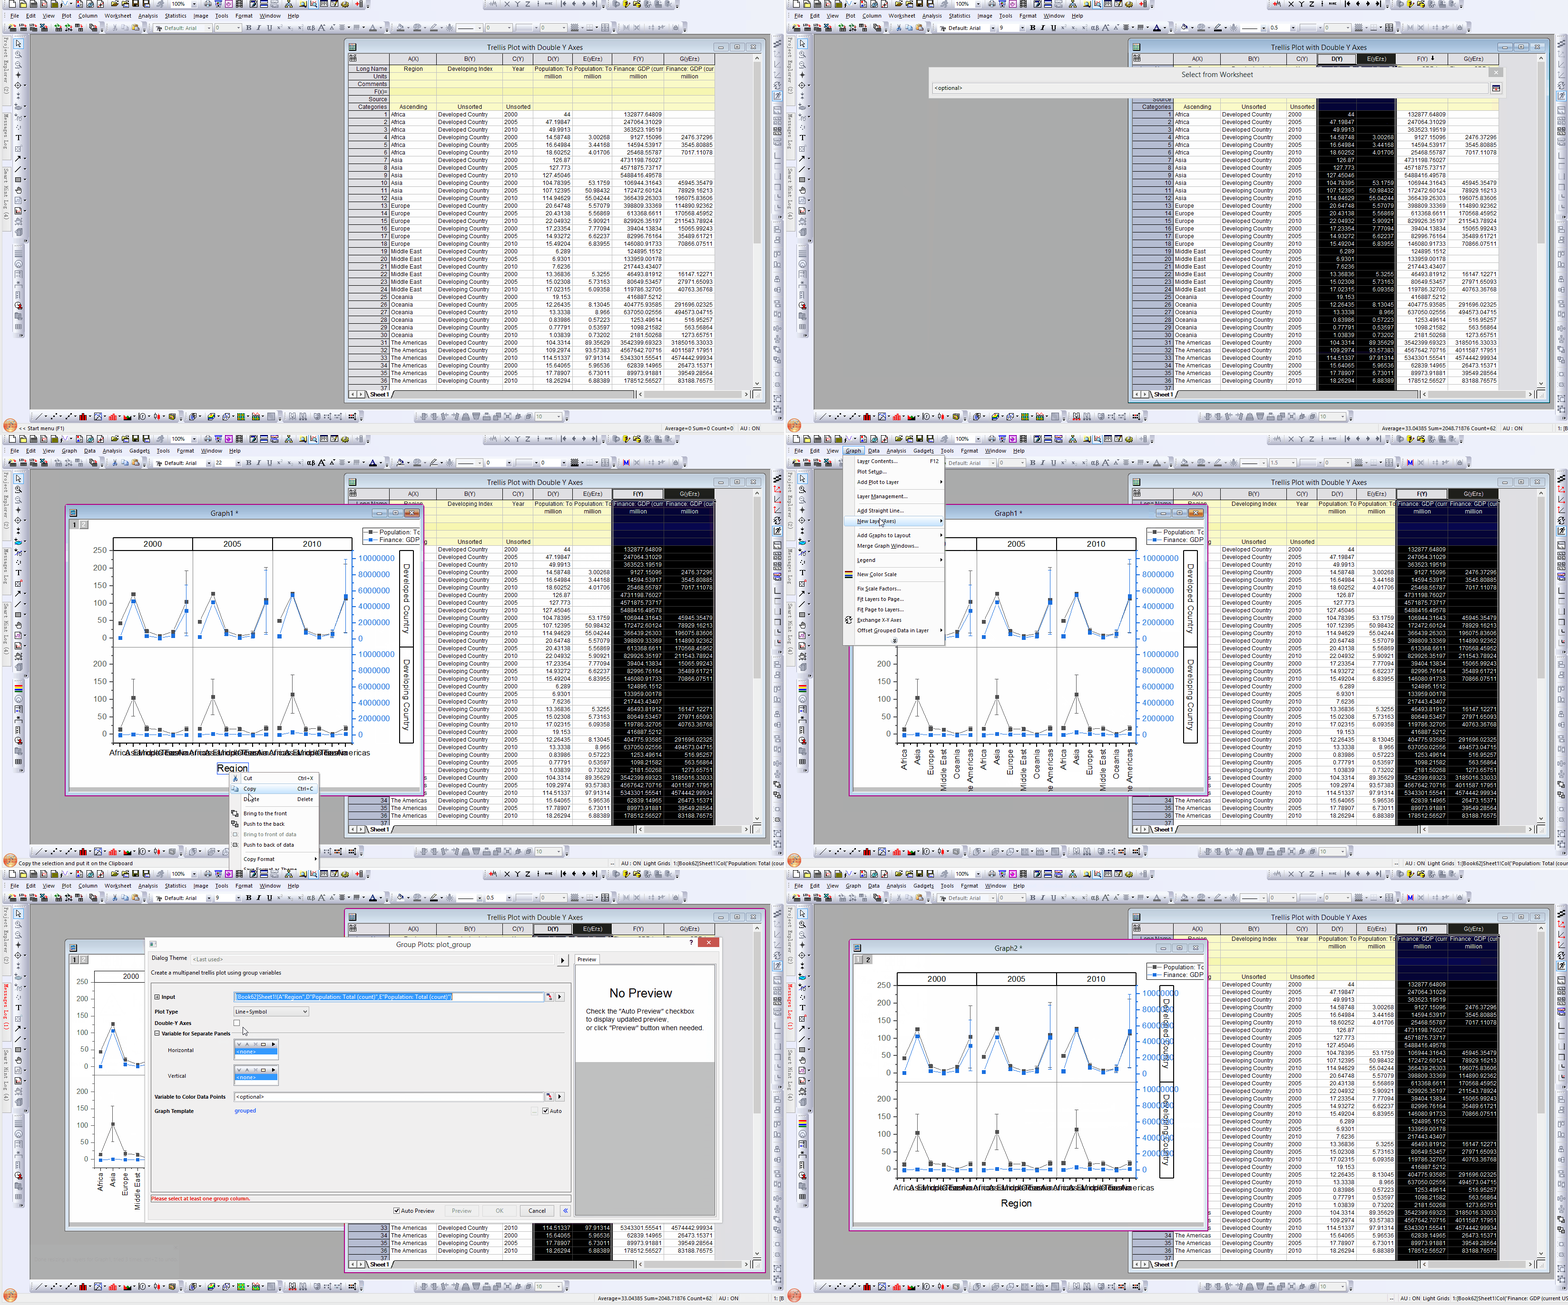
- Active the worksheet and select col(D) and col(E), then select Plot and Select Double Y Trellis
- After selecting Double Y Trellis from the Plot Menu, a dialog will appear. Input 1 is already selected however for Input 2: , select the worksheet icon in the Dialog box and select col(F) and col(G) from the worksheet.
- Under Variable for Separate Panels for Horizontal select C(Y): Year, and for Vertical select (B): Developing Index.
Note: You can select the option Trellis Plot from the menu bar, however you will need to check Double-Y Axes checkbox in the Dialog.
Click Start button in Origin 2019 and type Trellis to see more examples.


