


New in OriginPro 2023 and Origin 2023
No trial version yet?
OriginPro und Origin 2023 offer the following new features:
- Enhanced Project and Window Management
- Worksheet Enhancements
- Insert Worksheets in Graph or Layout
- Double-Y Graphs in Single Layer
- Smart Skipping of Symbols for Large Datasets
- Line-Symbol Plot with automatic X value sorting
- Angle Annotation Tool
- Text Box and Page/Layer Title
- Improvements to Exporting
- Improvements to Contour Plots
- Improvements to LabTalk Scripting
- New Graph Types
- New Apps
- Other Features
Enhanced Project and Window Management
OriginPro 2023 and Origin 2023 come several new features to improve organization and management of your Origin project:
- Folder Notes and Preview
- Show Graphs from Different Folders
- Seesaw between Folders
- Duplicate Folder
- Pin Windows
- Restore Window Size and Position
Worksheet Enhancements
The following features and improvements have been added to worksheets in OriginPro and Origin 2023:
- Banded Rows for Worksheet and Table in Graph
- Improved Worksheet Export to Image
- Copy Sheet or Selection as (HTML/EMF)
- Export to Excel with Cell Formatting
- Set up Frozen Panes
- Hide Sheets
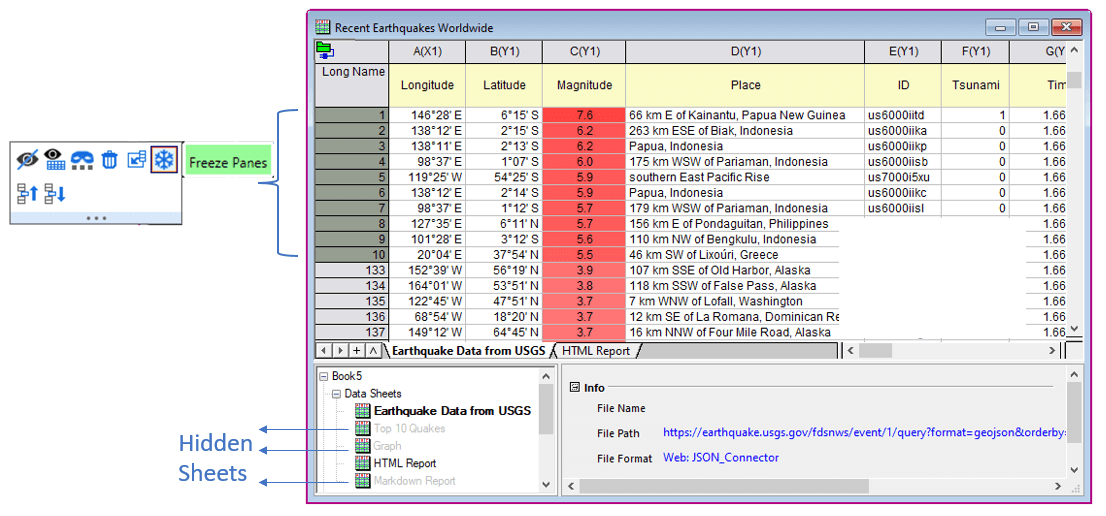
Freeze first n rows or columns. Hide sheets to reduce clutter.
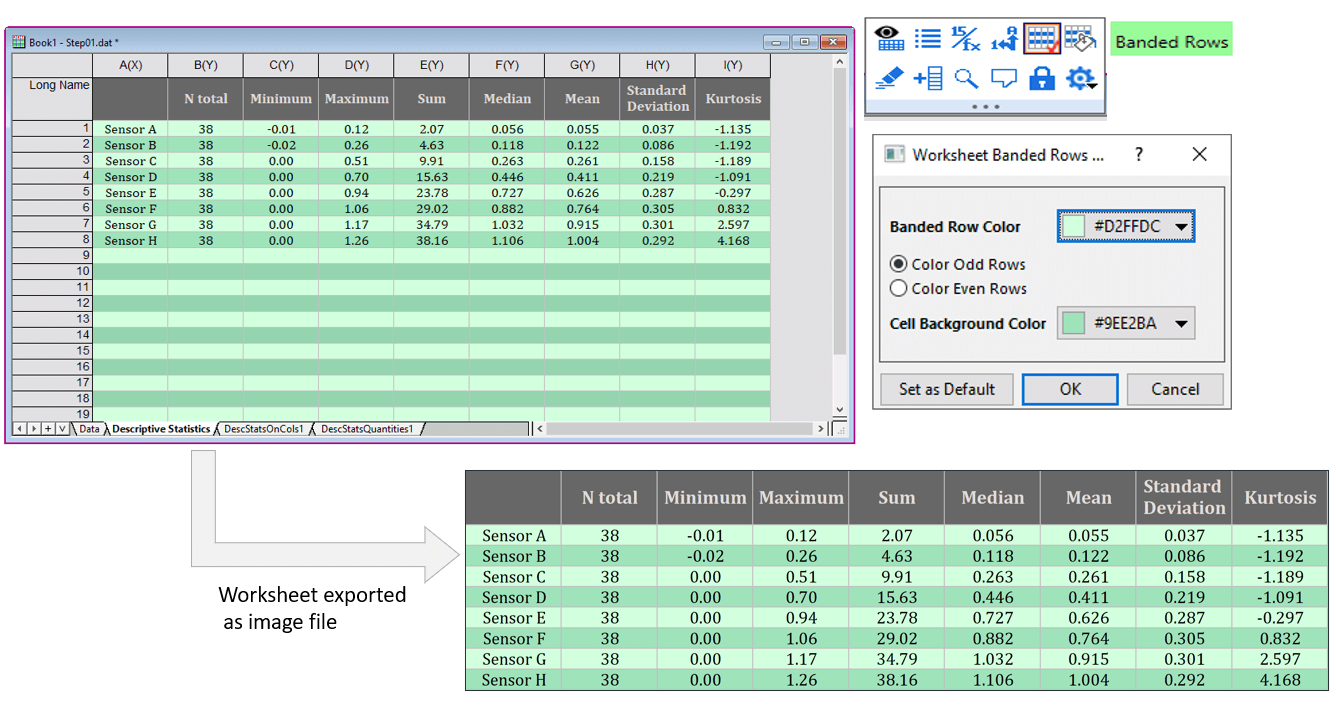
Set up Banding with custom colors and export as image
Insert Worksheets in Graph or Layout
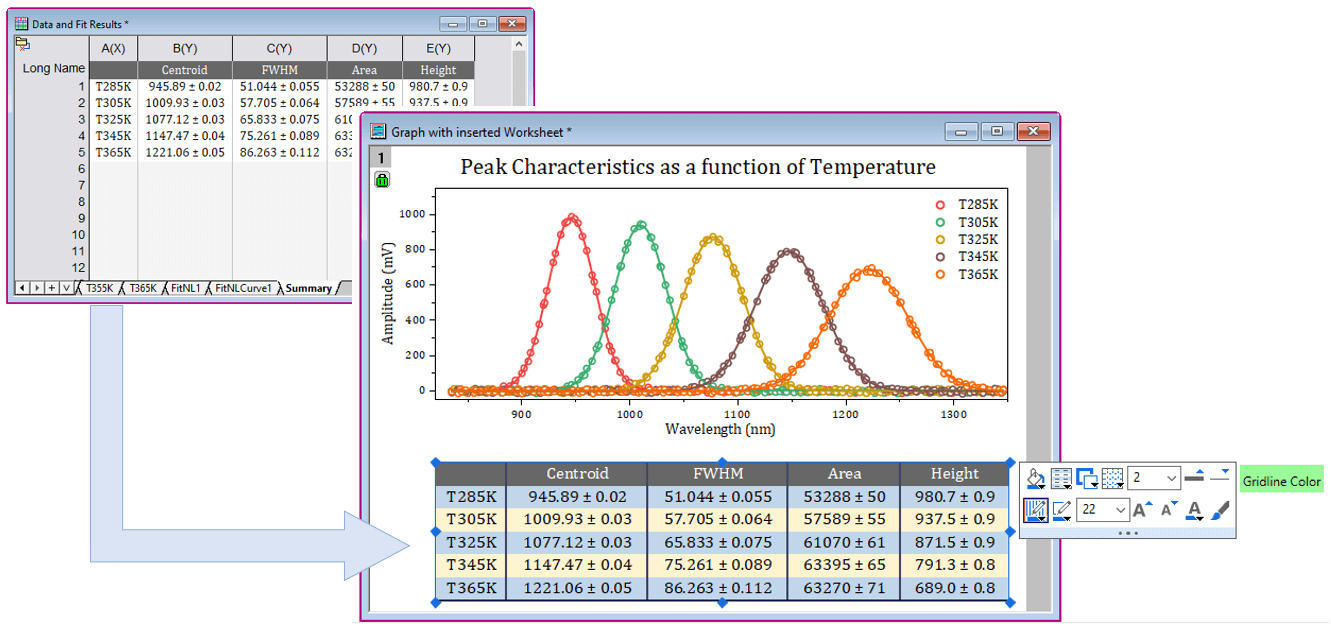
Insert worksheet in graphs or layout pages and further customize object to create custom reports
In OriginPro and Origin 2023, you can insert worksheets into graph or layout pages to create custom reports:
- Nicer sheet object with hidden column & row header and no margin
- Mini Toolbar to customize band colors, grid style, frame & grid color and thickness.
- Increasing/decreasing font size will automatically adjust table cell size
- Grid and frame customization kept when retrieving other updates from worksheet
Insert worksheet in graphs or layout pages and further customize object to create custom reports
Double-Y Graphs in Single Layer
Version 2023 supports plotting Double-Y graphs in a single layer, allowing easier manipulation and analysis of plotted data:
- Set scale of right Y axis to be independent of left Y
- Easily assign or switch plots to be associated with left or right Y axis
- Work with sub group of plots based on left or right Y axis
- Gadgets and other analysis tools will work on all curves in layer and will appropriately use the associated Y scale of the plot
Smart Skipping of Symbols for Large Datasets
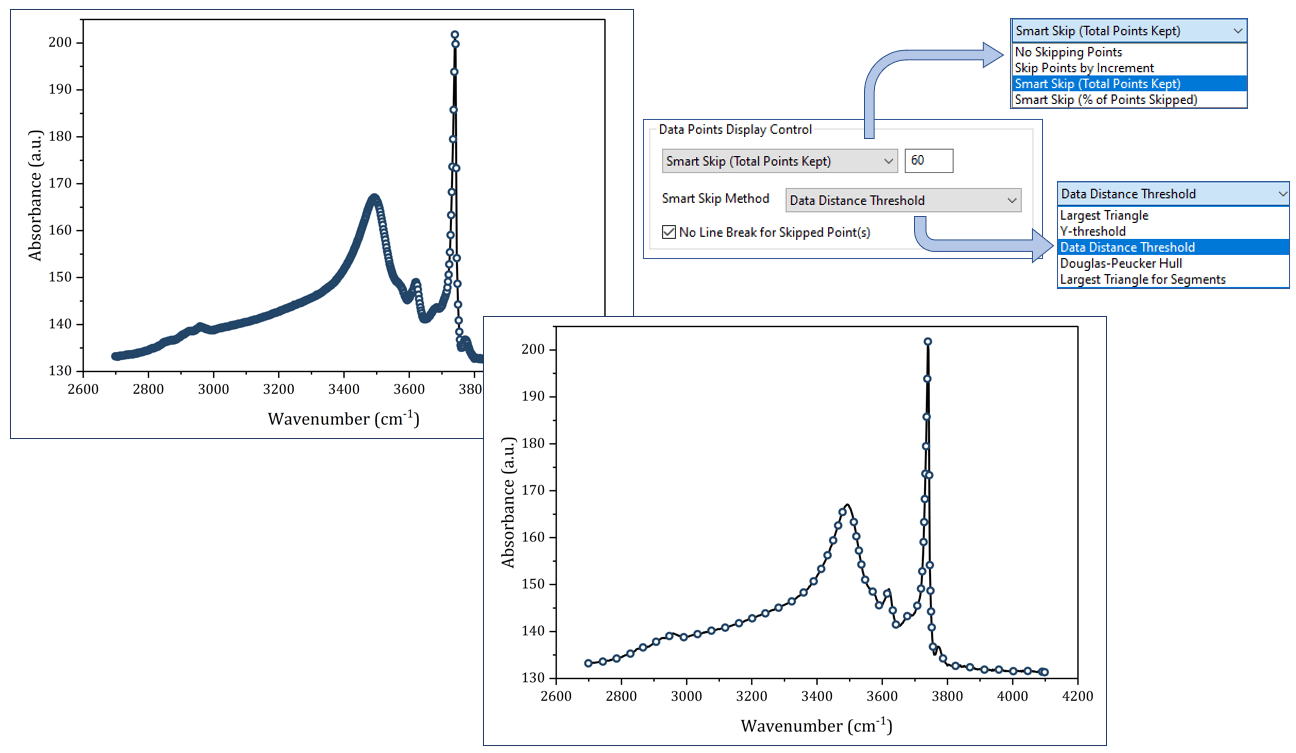
Skip symbols while maintaining overall data features
In OriginPro and Origin 2023, new methods have been added to skip symbols when plotting large datasets as symbol or line+symbol plots. This allows for a nicer presentation of data while maintaining overall features of the data. All analysis operations on graph will take into account the entire dataset. The control is available in the "Drop Lines" tab of "Plot Details" dialog
- Select between "Total Points Kept" or "Percentage of Points Skipped"
- Select from multiple skip methods (Largest Triangle, Y-threshold, Data Distance Threshold, Douglas-Peucker-Hull, Largest Triangle for Segments)
Skip symbols while maintaining overall data features
Line-Symbol Plot with automatic X value sorting
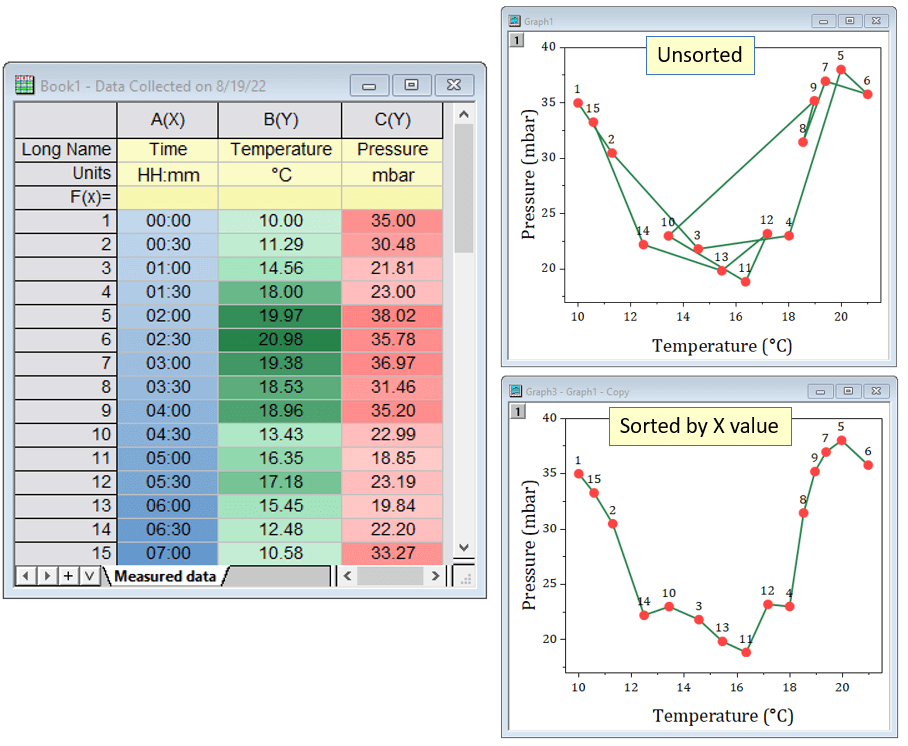
Apply x value sorting to data plot in graph without having to sort columns in worksheet
Perform automatic X value sorting of data in line or line-symbol plots without having to sort the worksheet columns. This is particularly useful when you have multiple columns in a worksheet and want to plot any two columns against each other, without having to reorder the worksheet rows.
Apply x value sorting to a particular data plot with this LabTalk script command: layer.plot1.line.sortx=1;
Once sorted, the graph can be saved as a template for future use, if desired.
Apply x value sorting to data plot in graph without having to sort columns in worksheet
Angle Annotation Tool
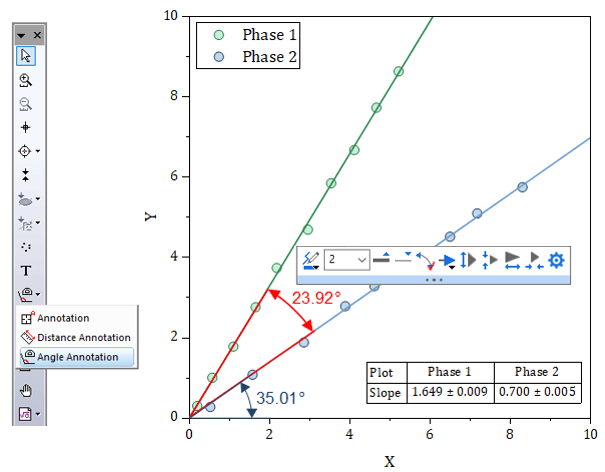
Add Angle Annotation to 2D graphs
In OriginPro und Origin 2023, a new tool for angle annotation in graphs has been added.
- Click and select three points in a graph to add the angle annotation
- Further customize the annotation using Mini Toolbar or properties dialog
Add Angle Annotation to 2D graphs
Text Box and Page/Layer Title
New Mini Toolbar buttons and properties have been added to support Layer and Page level titles in OriginPro and Origin 2023:
- For layer title, use layer level Mini Toolbar and click on the "Add Layer Title" button
- For page title, use page level Mini Toolbar and click on the "Add Page Title" button
- A center-aligned title box will be added, with wrap text enabled
- Size of box can be set as % of layer/page. The % setting will be maintained when layer/page is resized.
- Adding more text or increasing font size will result in auto wrapping. The centering and width will be maintained.
Improvements to Exporting
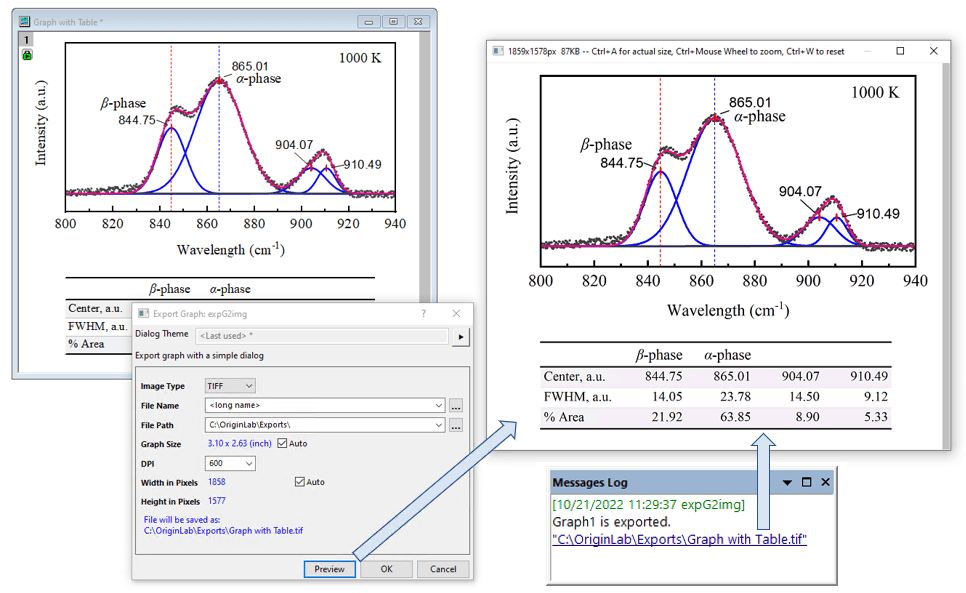
Click Preview button in export dialog or link in Messages Log for preview of exported image. Preview window supports zoom, including option to show image in actual size
The following improvements have been introduced for exporting:
- Clickable link in Messages log to open exported file or location
- Built-in viewer for immediate preview of raster and EMF exports
- Hot key to export graph with last-used theme
- Worksheet export to image supports frame and margin control
- Export video from browser graph, multi-frame image or multi-frame matrix
Click Preview button in export dialog or link in Messages Log for preview of exported image. Preview window supports zoom, including option to show image in actual size
Improvements to Contour Plots
In OriginPro 2023 and Origin 2023, the following improvements have been added for contour plots:
- Insert multiple custom contour levels with options for turning on lines and labels
- Mini Toolbar for customizing line and label properties, and extract data for contour lines at a selected level
Improvements to LabTalk Scripting
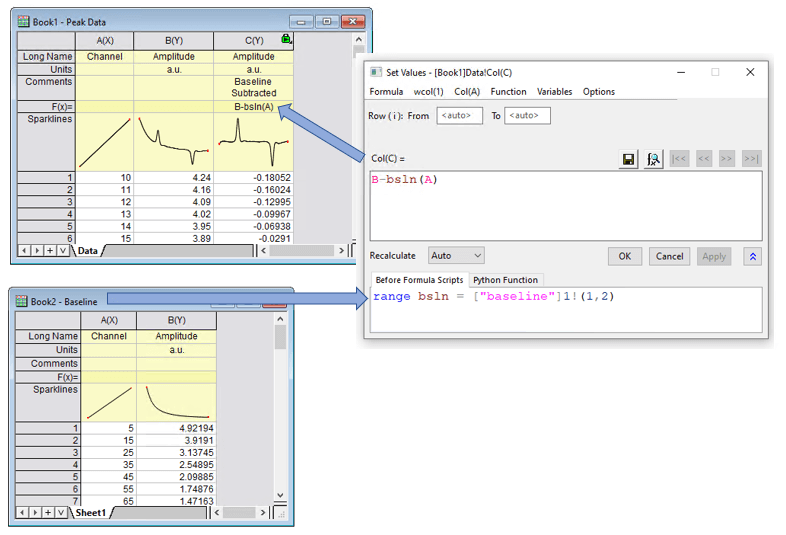
Use window long name in range notation to favor window within same folder
In OriginPro und Origin 2023, the following improvements have been added for LabTalk Scripting:
- Improved Script Window with Unicode Support
- Use window long name in range notation to favor window in same folder
- Named range to specify 3D plane position
- Execute script stored in worksheet cell using Labtalk://<script>
- Select Columns by LabTalk Script
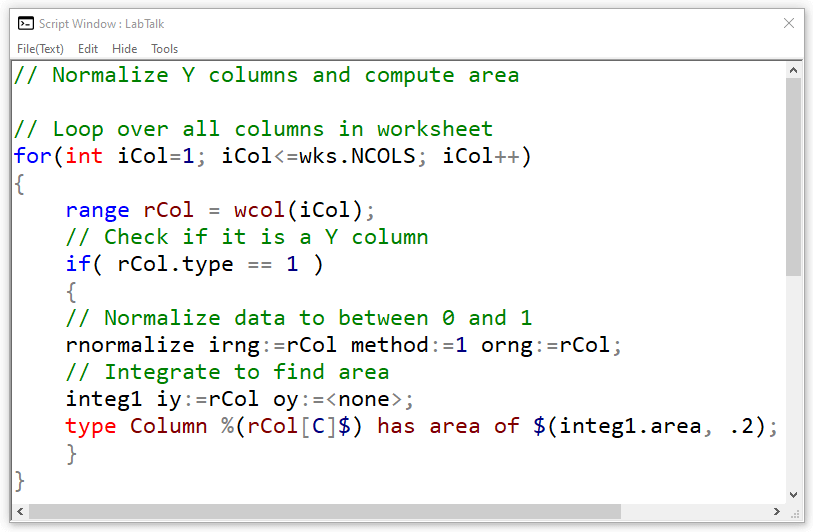
Improved Script Window with Unicode support, syntax coloring, improved font and font size control, and ctrl+mouse to zoom and pan
Use window long name in range notation to favor window within same folder
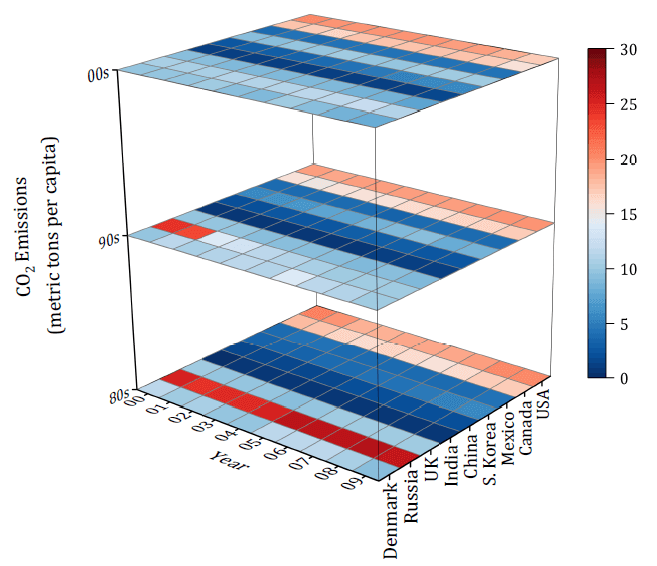
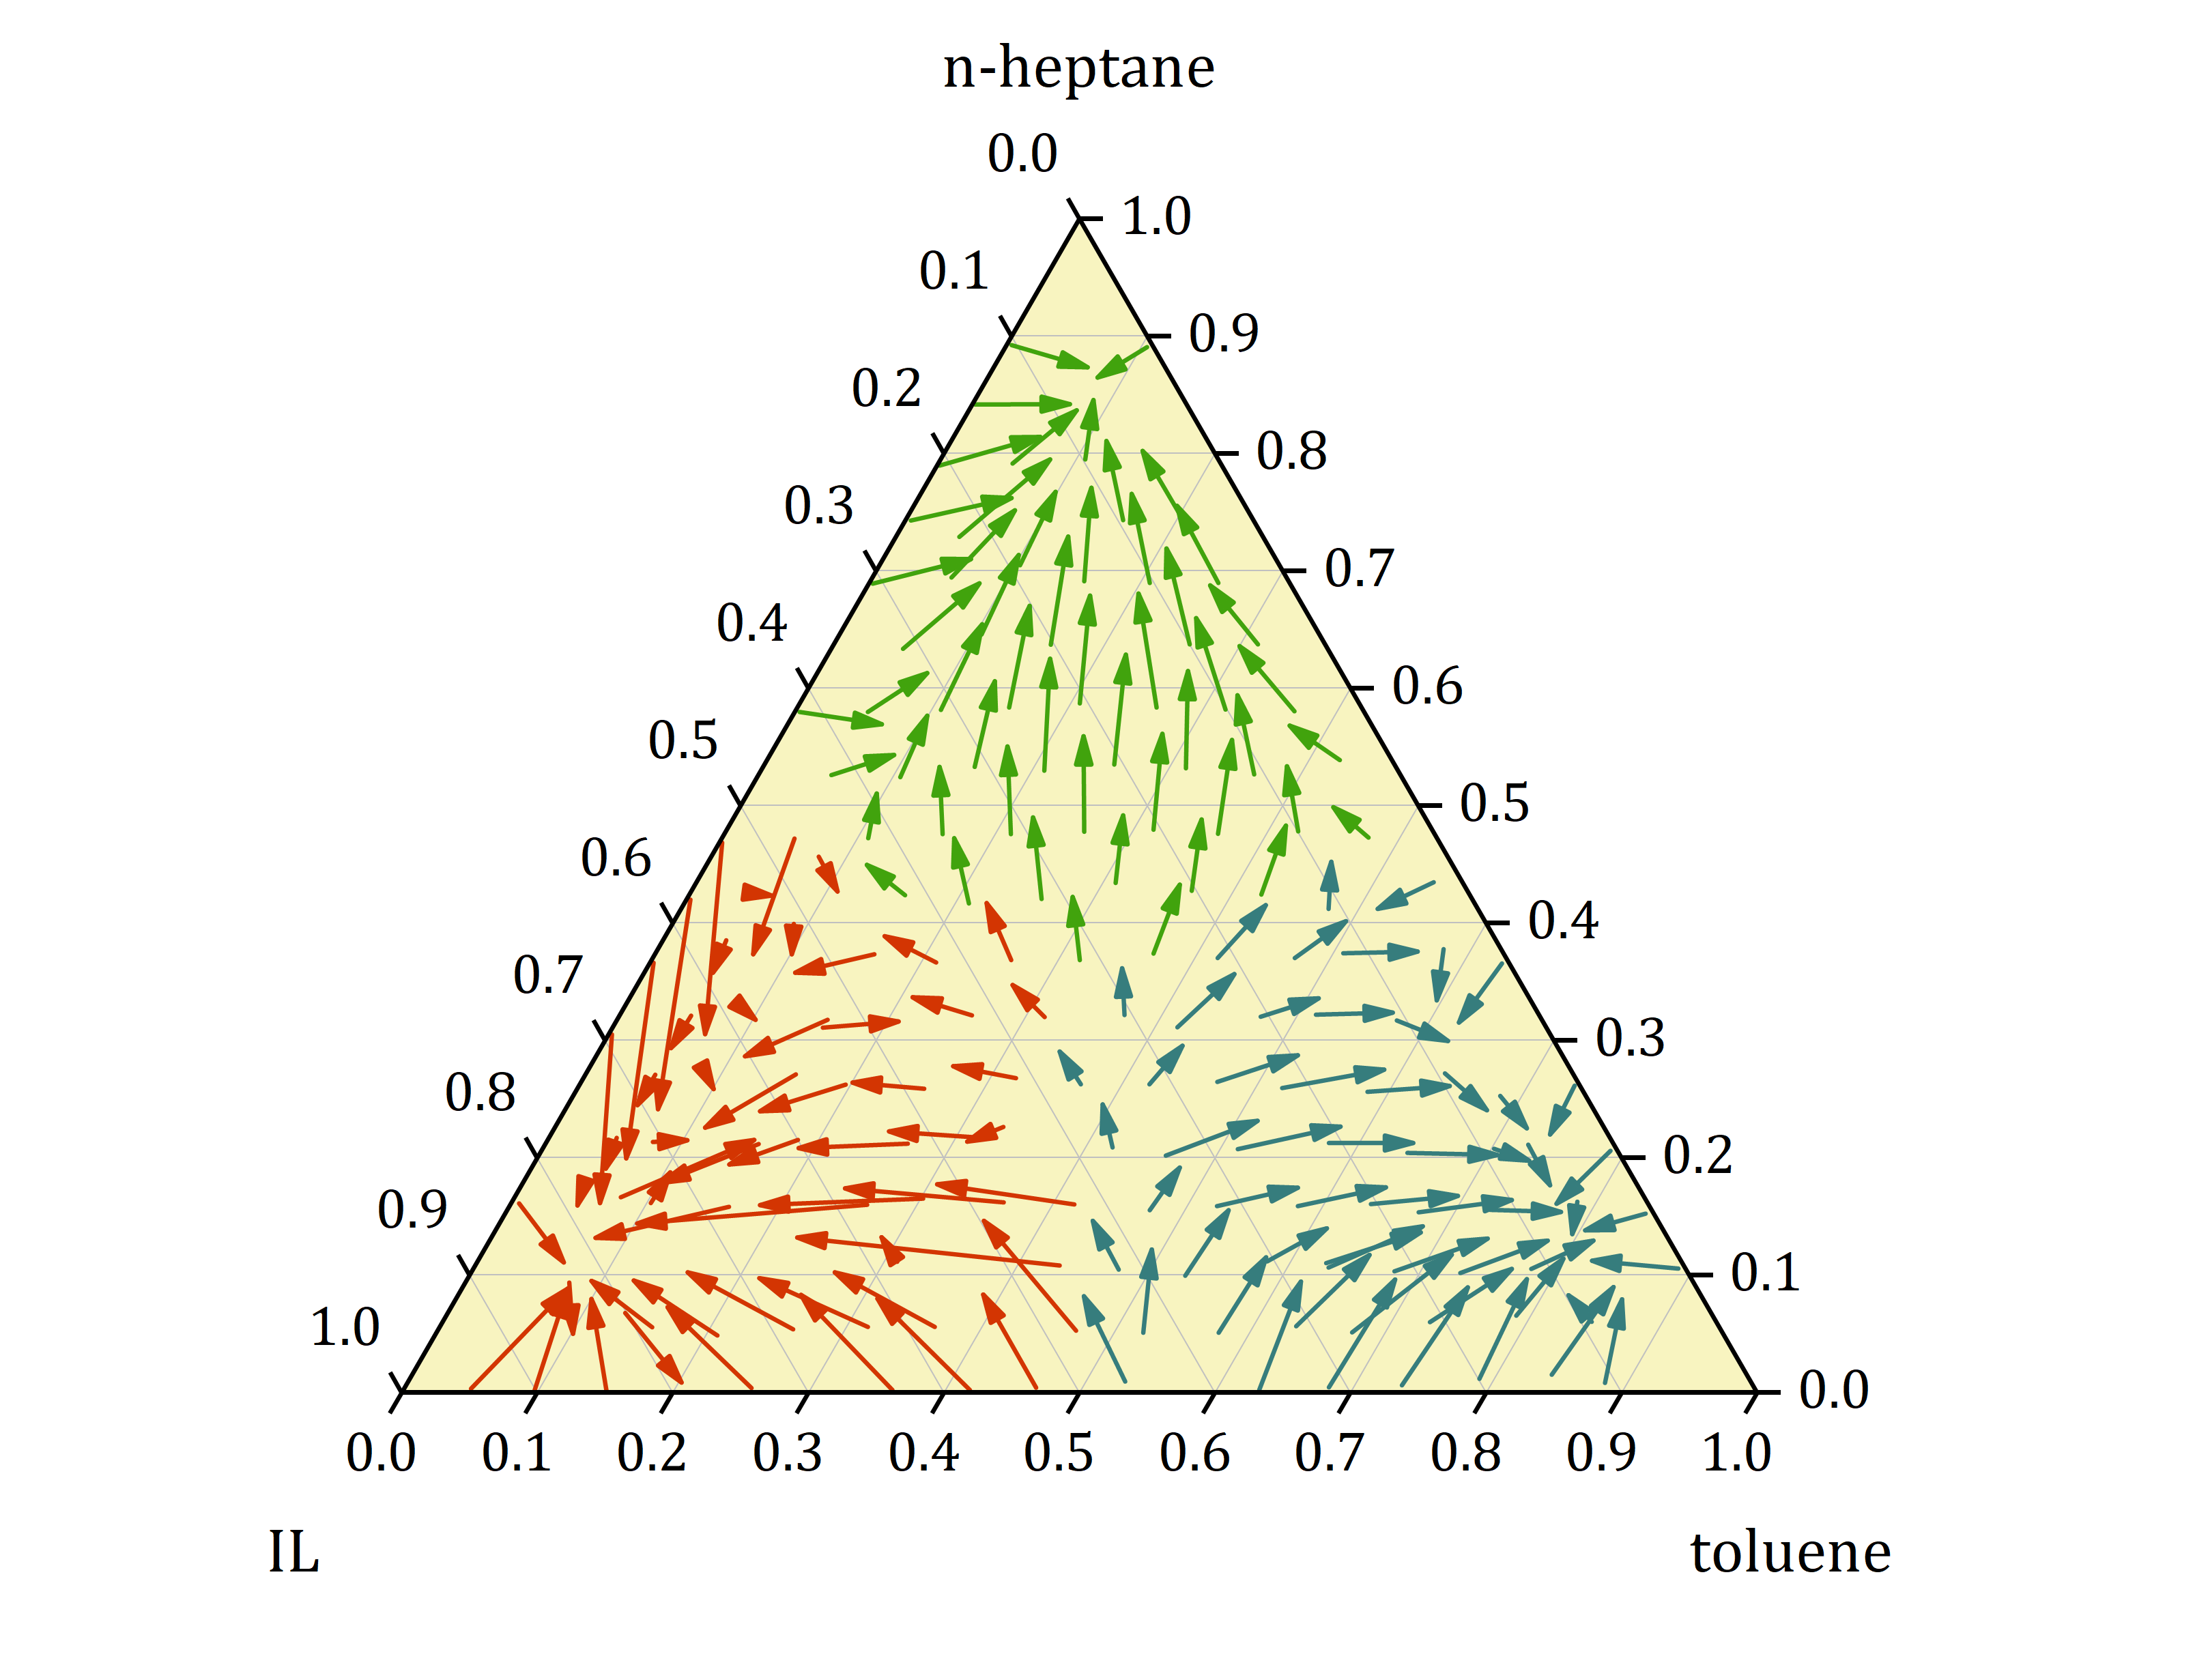
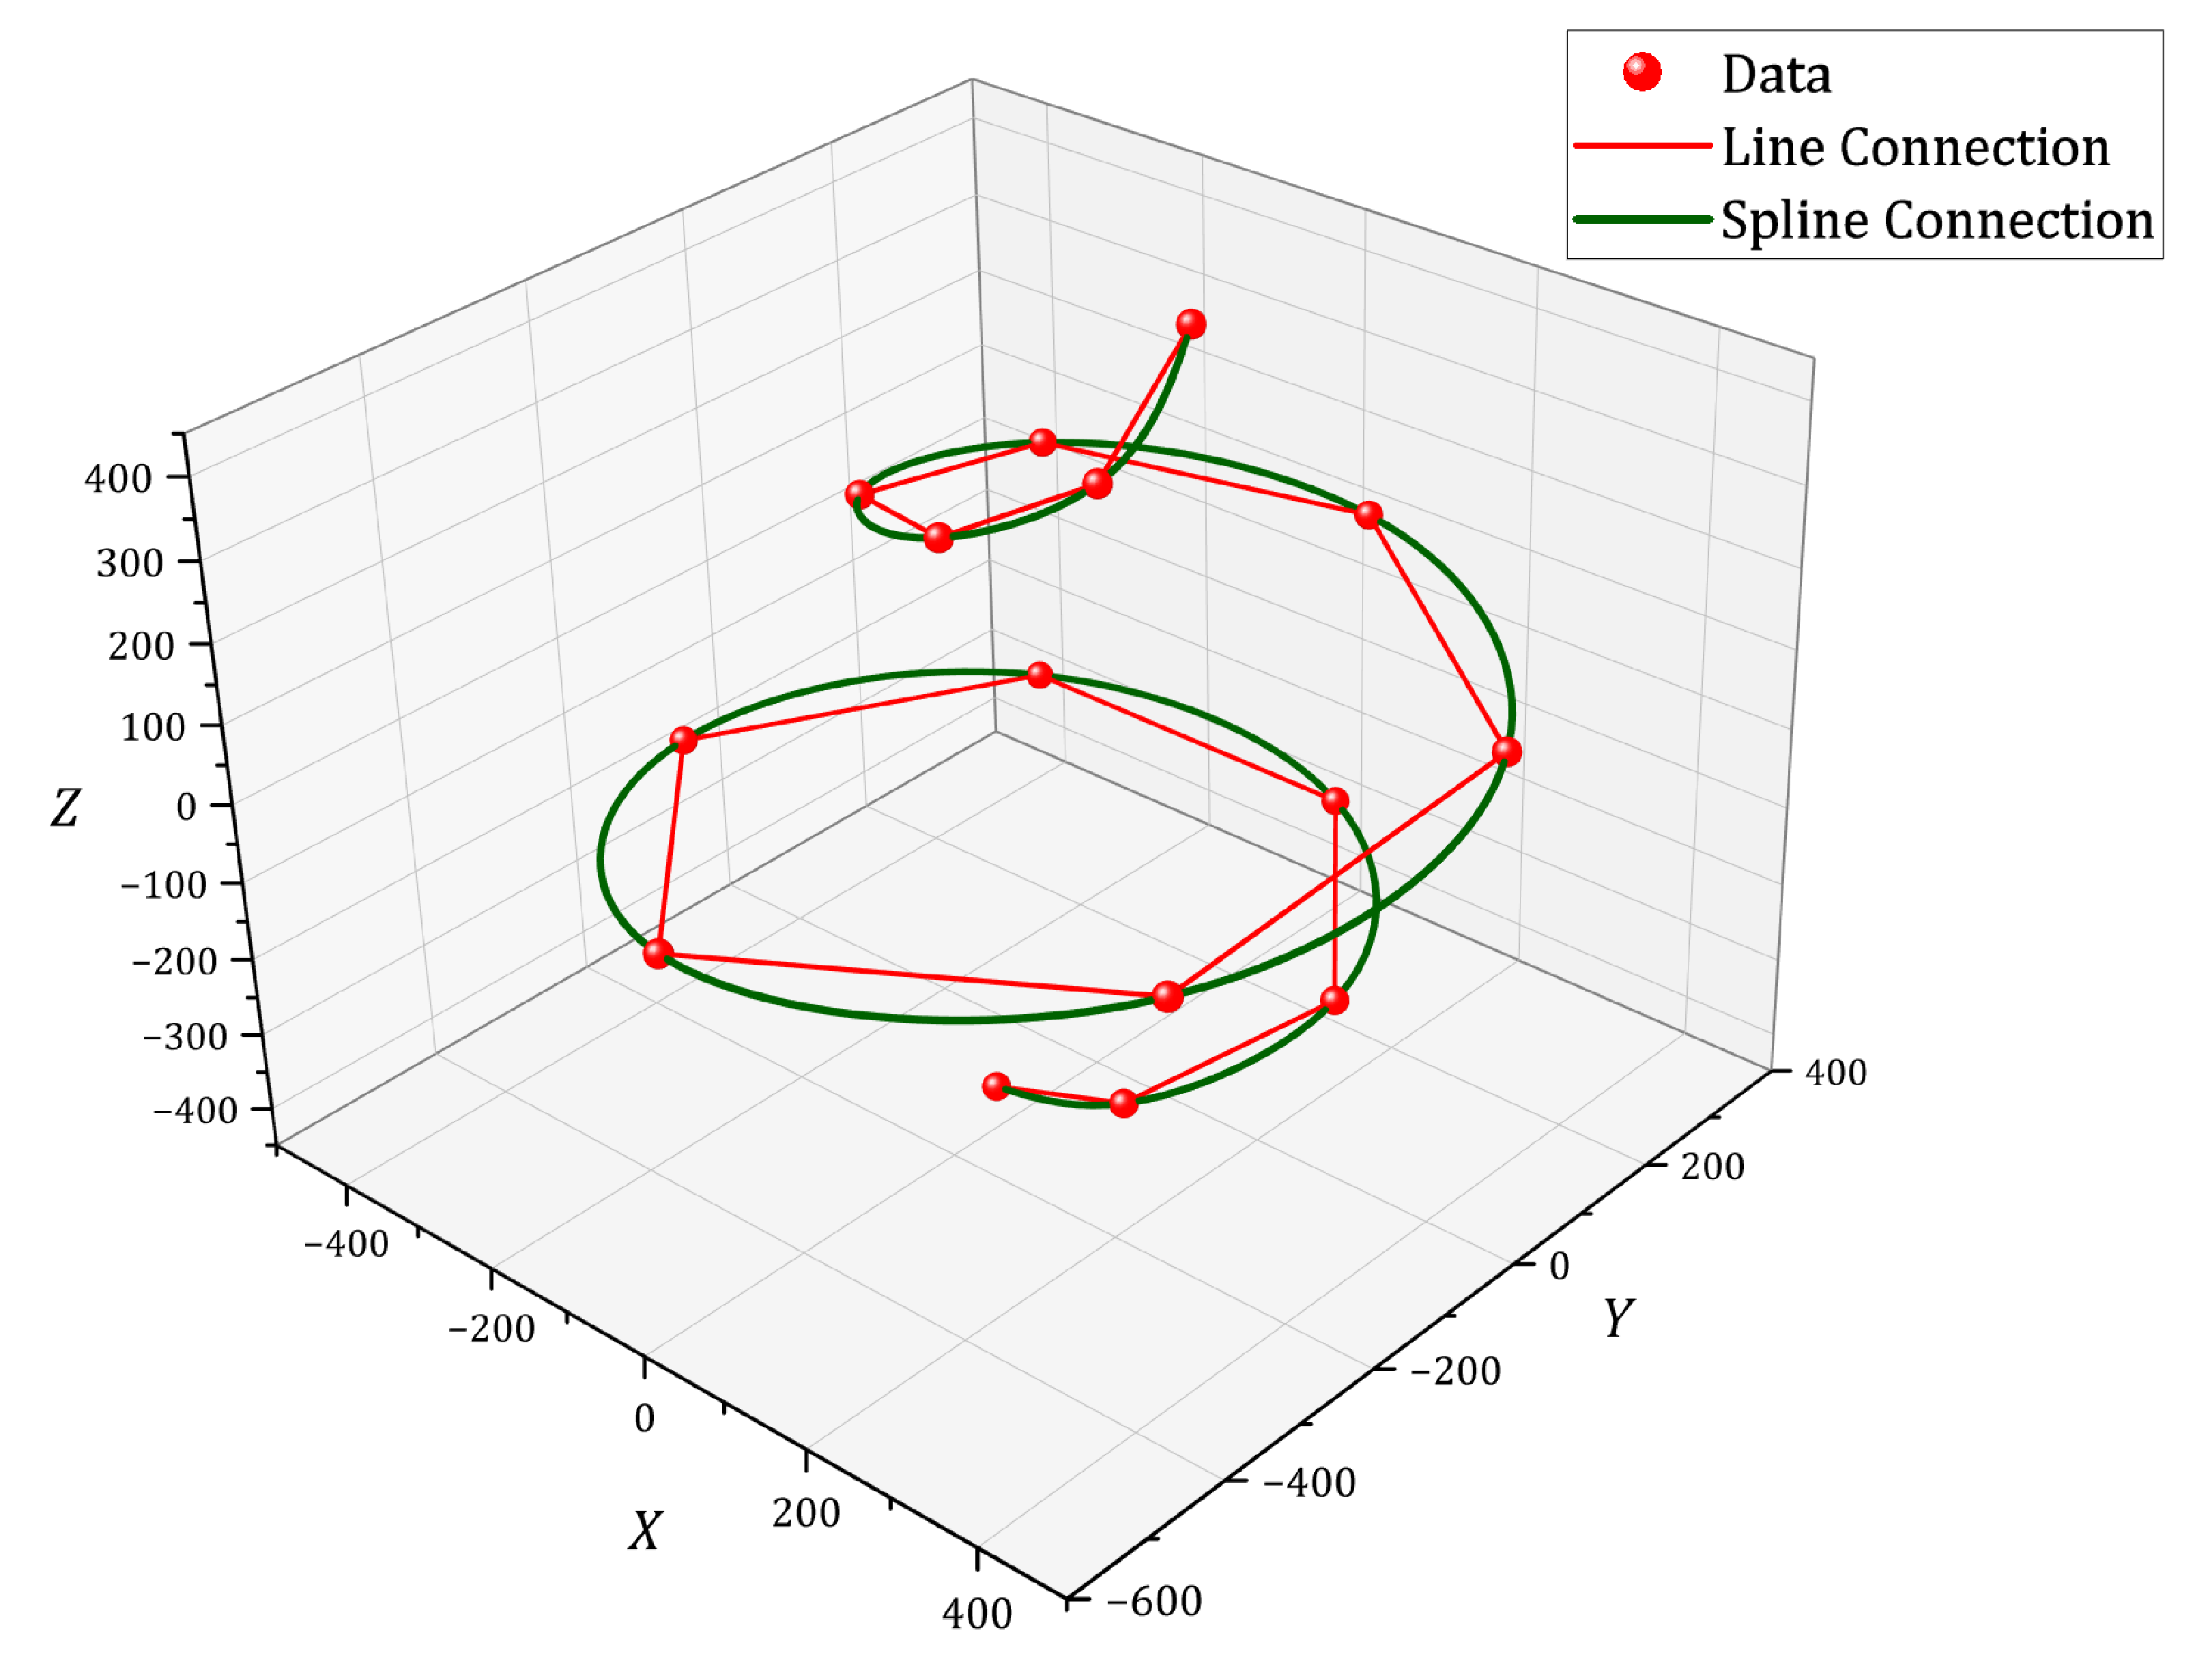
New Graph Types
The following new graph types have been added in version 2023:
- Stacked 3D Heatmap
- Ternary Vector
- 3D Line Spline Connection
New Apps
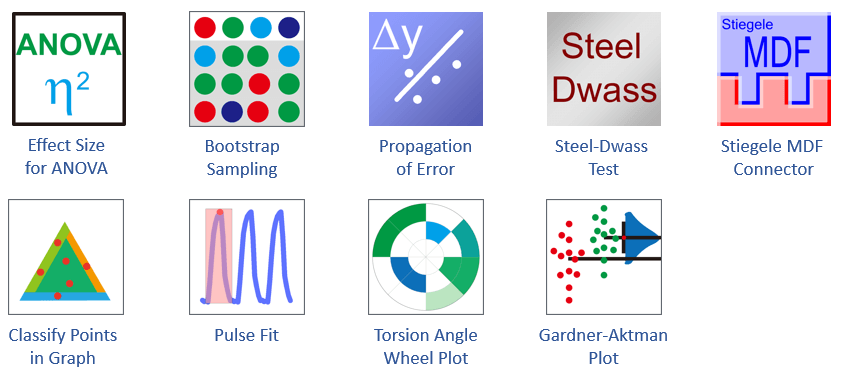
The following new Apps are available with the latest version 2023:
- Statistical Process ControlPRO
- Bootstrap SamplingPRO
- Pulse FitPRO
- Propagation of ErrorPRO
- Classify Points in GraphPRO
- Gardner-Altman PlotPRO
- Steel-Dwass TestPRO
- Effect Size for ANOVAPRO
- Torsional Angle Wheel PlotPRO
- Stiegele MDF Connector
Other Features
General
- Wrap rich text in worksheet
- Sparkline, renaming and post script control in Data Connector
- File Path Link in Cell
- Clickable links on Messages Log
- Tooltip when mousing over menus
- Options dialog for Protected Worksheet properties
- NetCDF import now supports yearly data nc4 files
- XML import now supports importing metadata node
- Copy and Paste-Link metadata values from Book Organizer to Worksheet cells
- High resolution toolbar button on 4K monitors
Graphing
- Alternate sides to show ticks and labels
- Turn off selection for layer, plot, text, etc. using Mini Toolbar
- Layer arrangement direction
- Stack plot horizontally
- Ctrl+Alt+G to export graph with last used theme
- Asterisk Bracket shape control
- Insert user-defined color block in Legend
- Set default reference line style
- Build color improvements
Data Manipulation
- Move rows up/down
- Manage multiple sheets together
- Normalize data by Group
- Merge columns by median and multiple quantities
- Unstack column output improvements
- Convert multiple Z data to matrix
- Cluster gadget with color mapped Z value stats
- Create linked matrix from ROI in image window