


Overview of Blog Entries for Diagrams in OriginPro and Origin 2020b
Radial Stacked Bar in OriginPro and Origin 2020b
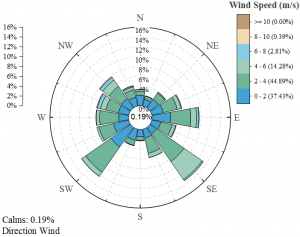
he wind rose plot is a very popular type in environmental science. While in fact, it is just a specific application of a stacked column plot on a polar coordinate.
However, if you're working with categorical data, you'll have to assign different X values based on the number of items in your list as angle, which can be annoying sometimes and hard to automate without a customized script. Thus in Origin 2020b, it was added as a new graph type under plot menu so that you can create it with one click.
Read more at the OriginLab Blog
Easy Correlation Plots in OriginPro and Origin 2020b
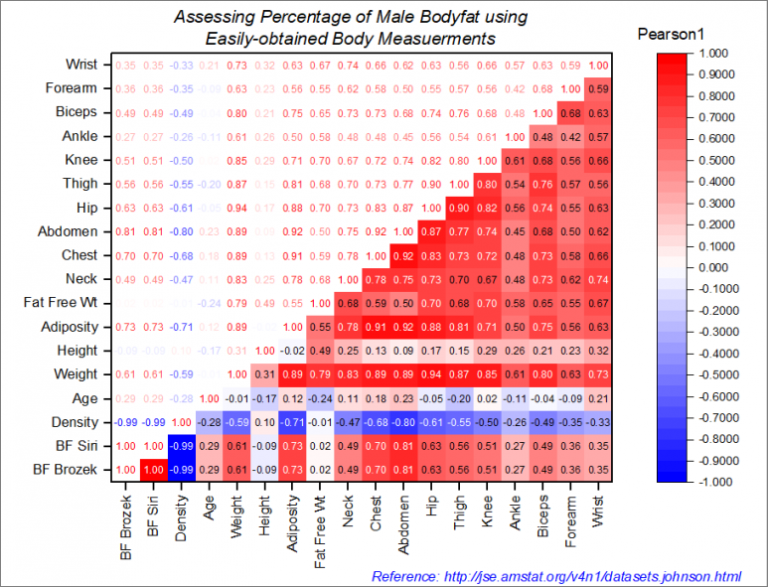
Heatmaps (heat maps) are graphs produced by applying a color map to a 2D array of numbers. The resulting graph gives the viewer a quick, big-picture view of often complex relationships, making the heatmap an ideal tool for publication and presentation.
A correlation matrix is produced by repeating measurements across a fixed set of variables, on a group of subjects, then making pairwise comparisons between variables to determine their degree of correlation. A correlation matrix heatmap — or simply "correlation plot" — is produced by applying a color map to the correlation matrix. The resulting graph allows the viewer to quickly assess the degree of correlation between any two variables.
Read more at the OriginLab Blog
Introducing the Browser Graph in OriginPro and Origin 2020b
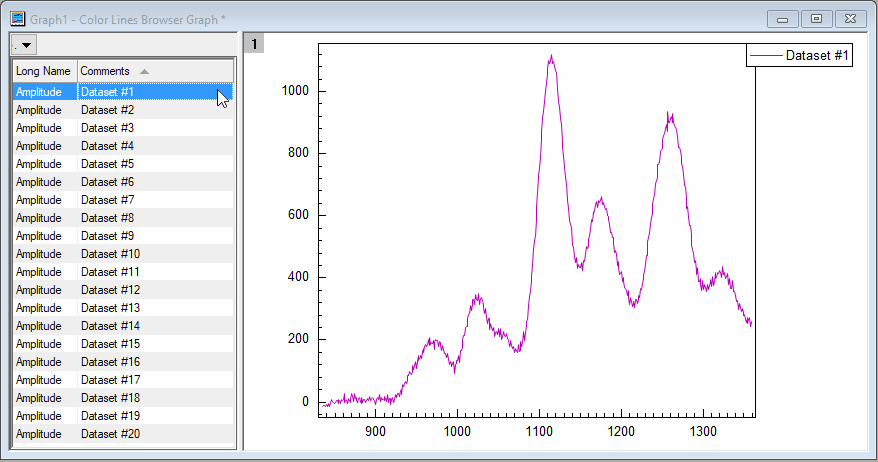
There is a new family of graphs in Origin 2020b called Browser Graphs. They are designed for easy visual inspection of multiple datasets with the same structure such as test and measurement data. There are two line-plot based Browser Graphs- Black Lines and Color Lines– and one histogram-based Browser Graph aptly named Histogram. In this blog post an overview of Browser Graphs is given along with an example of how Origin Gadgets may be used in conjuction with them to super power the visual inspection experience.
Read more at the OriginLab Blog
Streamline Vector Plot in OriginPro and Origin 2020b
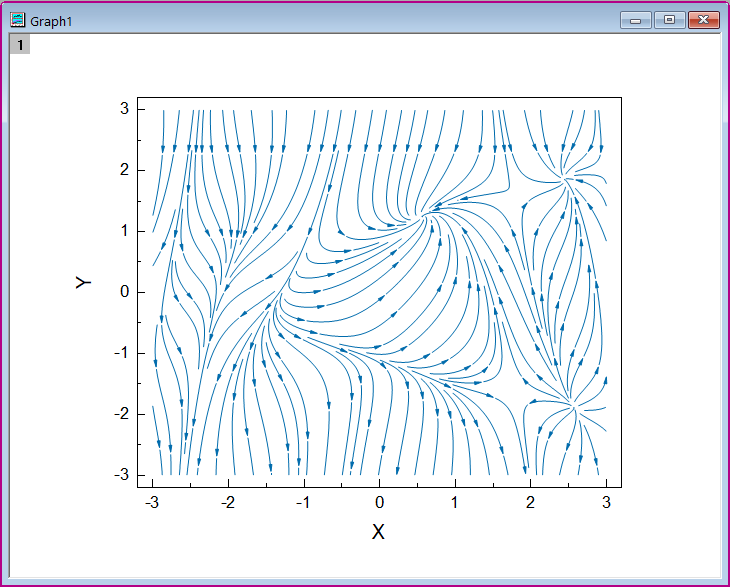
A Streamline plot is a representation based on a 2-D vector field interpreted as a velocity field. Origin starts to support this new graph type in version 2020b. In this blog, a streamline graph of the vector field {vx,vy} as a function of x and y, where vx = cos(x2+y), and vy = x-y2+1, is going to be generated.