


New in OriginPro 2021b and Origin 2021b
OriginPro and Origin 2021b offer the following new features:
- Insert Map to Graph and Shapefile Import
- Enhancements to Embedded Python
- Mini Toolbar for 3D Graphs
- Climate Data: NetCDF Import and Matrix Analysis and Graphing
- SQLite Import and Export
- Enhancements to Worksheet Calculations
- New Dialogs for Graph and Workbook Templates
- Data Slicer for Graphs
- Improvements to Browser Graph
- New Graph Types
- Extended Graph Templates
- New Apps
- Other Features
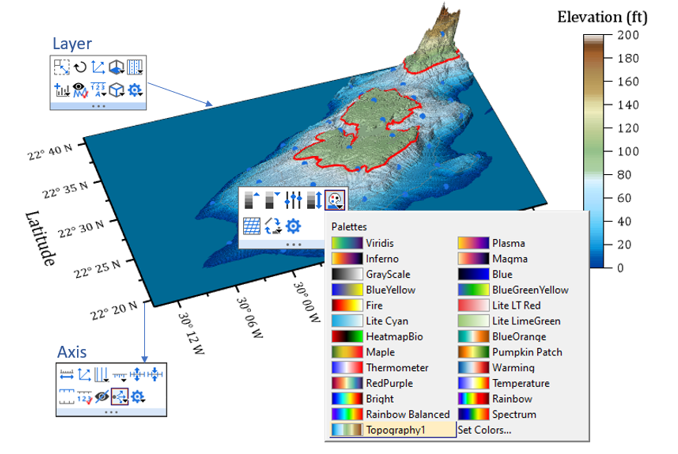
Insert Map to Graph and Shapefile Import
OriginPro and Origin inlcude with version 2021b the following key features for maps and shape files:
Insert map as outlines to a graph
More information on Maps in Diagrams and import of Shapefiles
Enhancements to Embedded Python
In OriginPro and Origin 2021b, several improvements have been made to the Embedded Python environment in this version::
- Define Python functions in "Fitting Function Builder" and "Peak Analyzer"
- Intellisense support in Python Console
- Support for Python script in Buttons
- Access to Analysis Reports, Metadata, and Tree
- Access to Curve Fitting
- Extended collection of code samples organized by category
More information on the enhancements to embedded Python
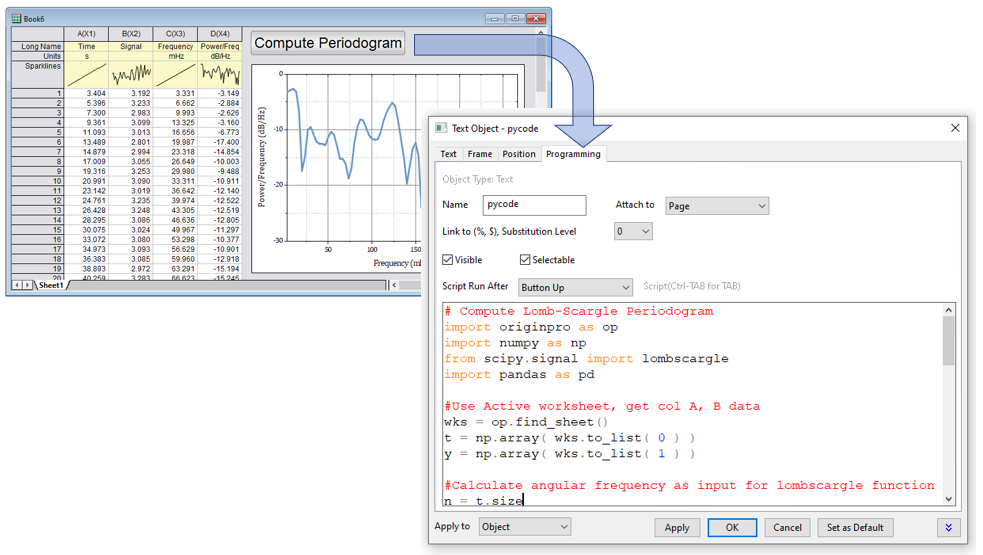
Run Python script directly from a button placed on a worksheet, matrix or graph.
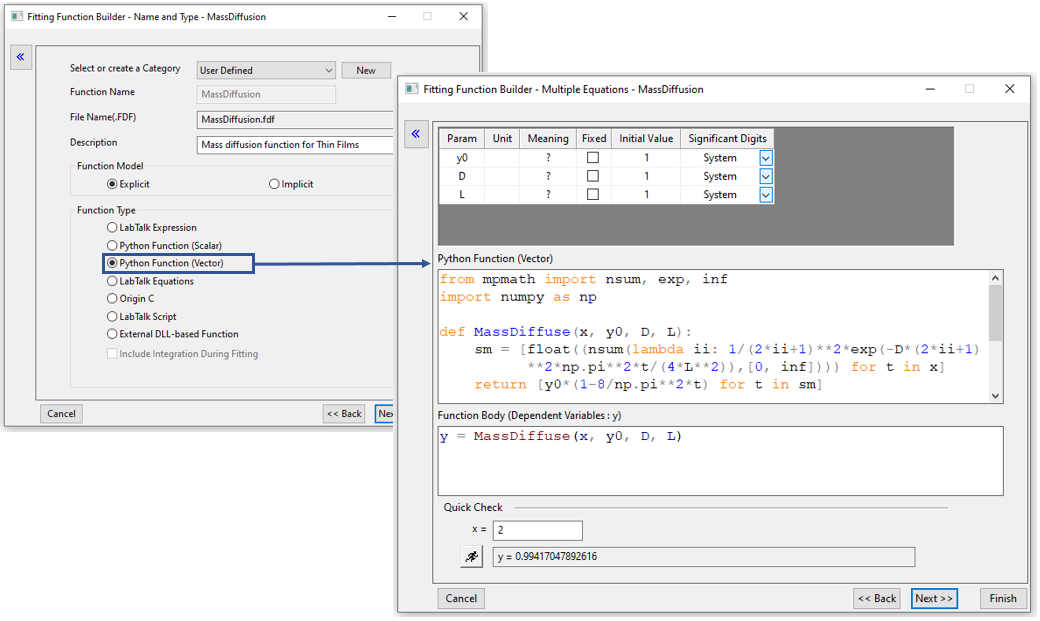
Custom fitting function using Python script
Mini Toolbar for 3D Graphs
A new set of Mini Toolbars has been added in version 2021b to support 3D graphs, to make quick changes to:
- Scatter Plot
- Error Bars
- Bar Plot
- Surface Plot
- Ribbon and Wall Plots
- Vector Plot
- Axes, Layer and Page
Climate Data: NetCDF Import and Matrix Analysis and Graphing
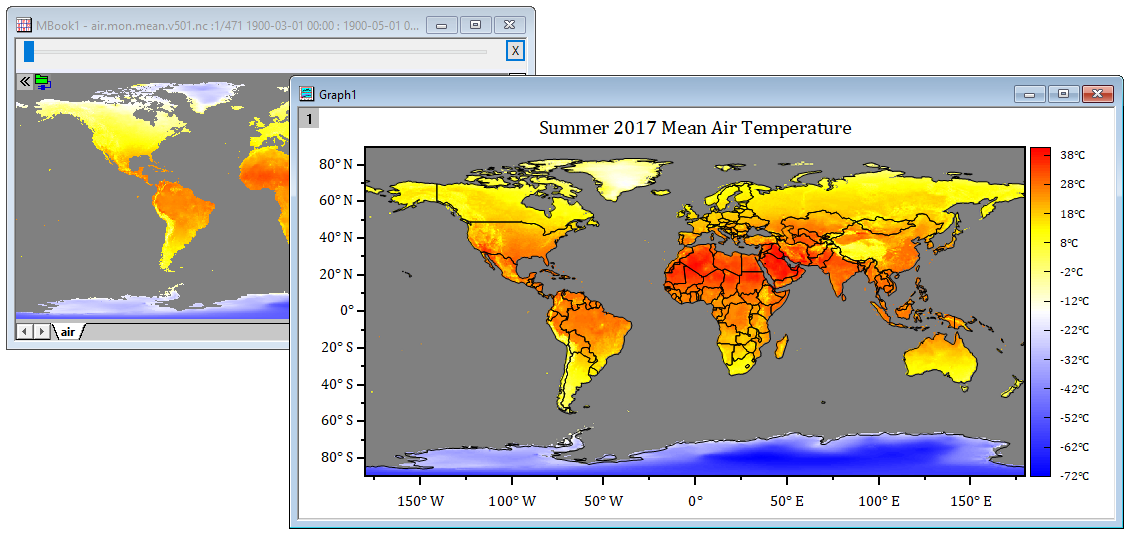
- Import and reduce NetCDF file by partial import or averaging during import
- Matrix Image Stack to support Shapefile-based ROI averaging to create time axis profile
- Matrix stats, subtraction, simple math, linear fit along time axis
- Browser Graph for contour and image plots from matrix stack
More information on matrixbased NetCDF functions
SQLite Import and Export
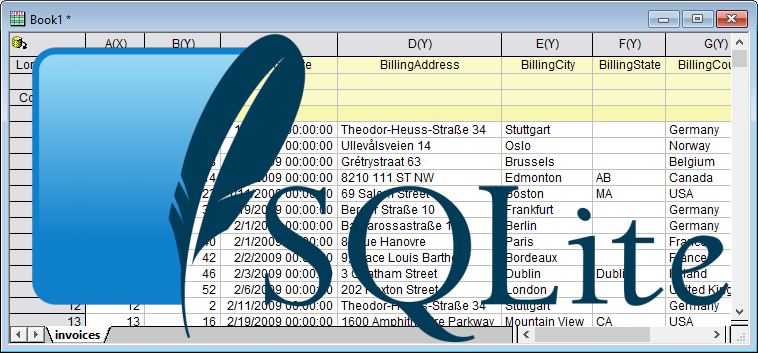
- Import from SQLite files using Database Connector
- Option to Unlock Imported Data from menu
- Export/Update worksheets as tables in a SQLite database file
Enhancements to Worksheet Calculations
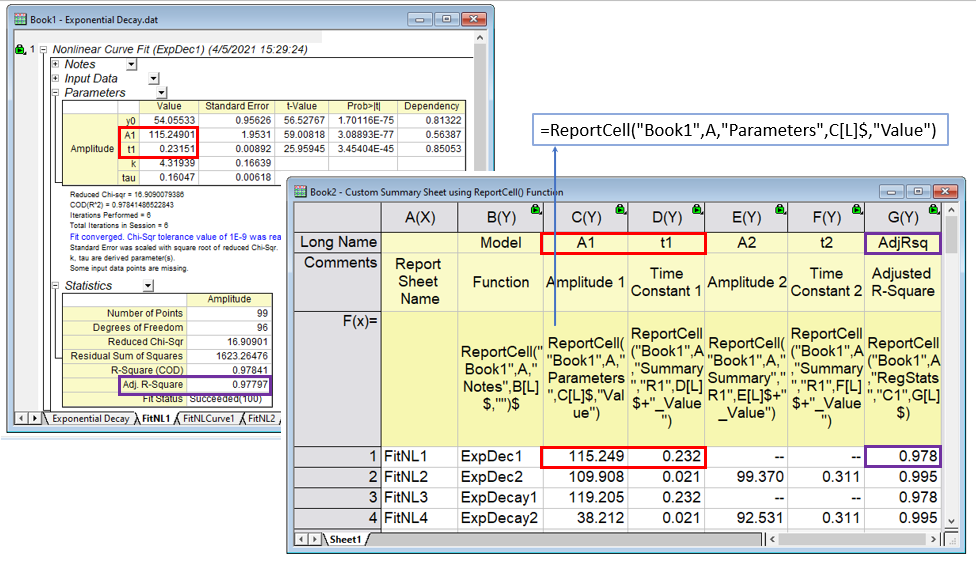
Use
ReportCell() function to pick up specific values from report sheets such as Nonlinear Fit reports, to create your own custom summary.
In OriginPro and Origin 2021b, several new functions have been added to further facilitate worksheet calculations:
idx(): Return row indices of records that meet specified conditionReportCell(): Access values from report sheetsSum(): Improved to calculate row wise Mean, StdDev, Min, Max, N, Median. E.g.sum(A:F)_sd- More statistics functions:
lcl,ucl,mad,geomean,geosd,harmean
Use
ReportCell() function to pick up specific values from report sheets such as Nonlinear Fit reports, to create your own custom summary. New Dialogs for Graph and Workbook Templates
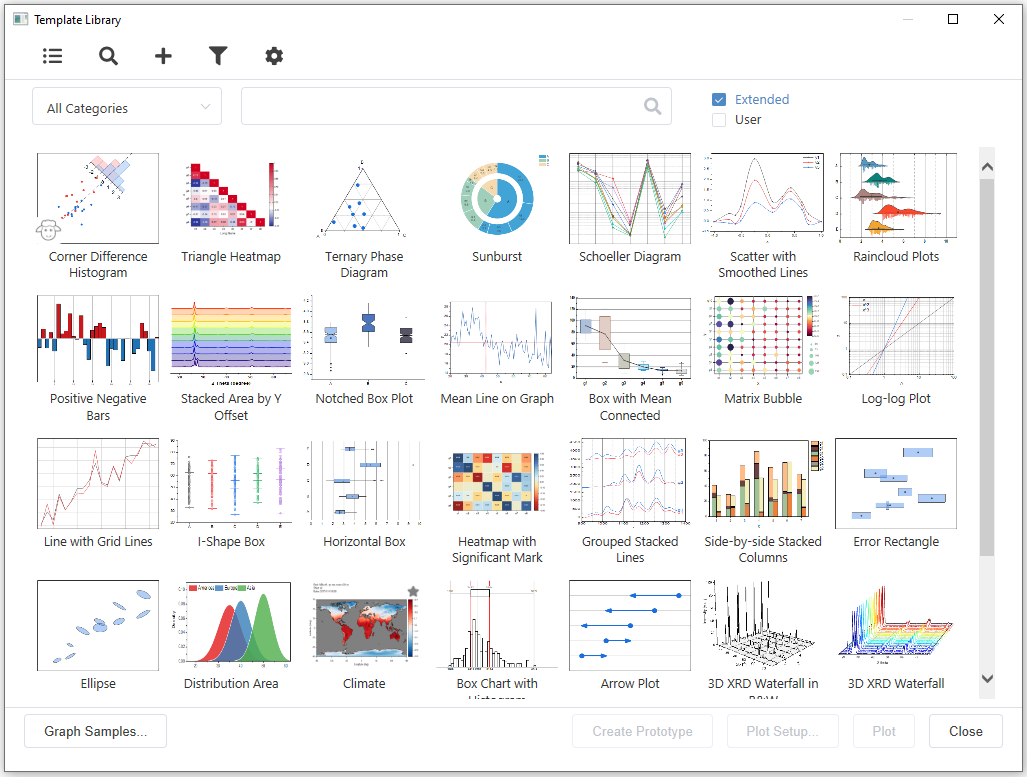
Version 2021b introduces new dialogs for managing both Graph and Worksheet templates. The new dialogs provide much better access and management of User-defined templates and the Extended templates shipped with the product.
- List View to allow sorting by Name, Category, date etc
- Select Graph Template to appear in "Plot > My Template" menu
- Select your favorite Book template to appear in "File > New" menu
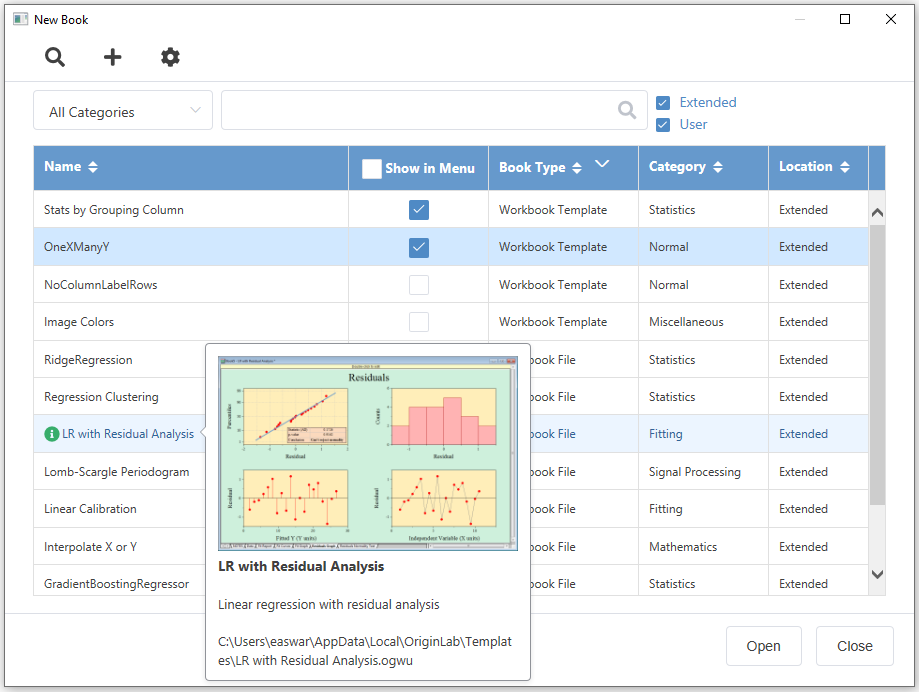
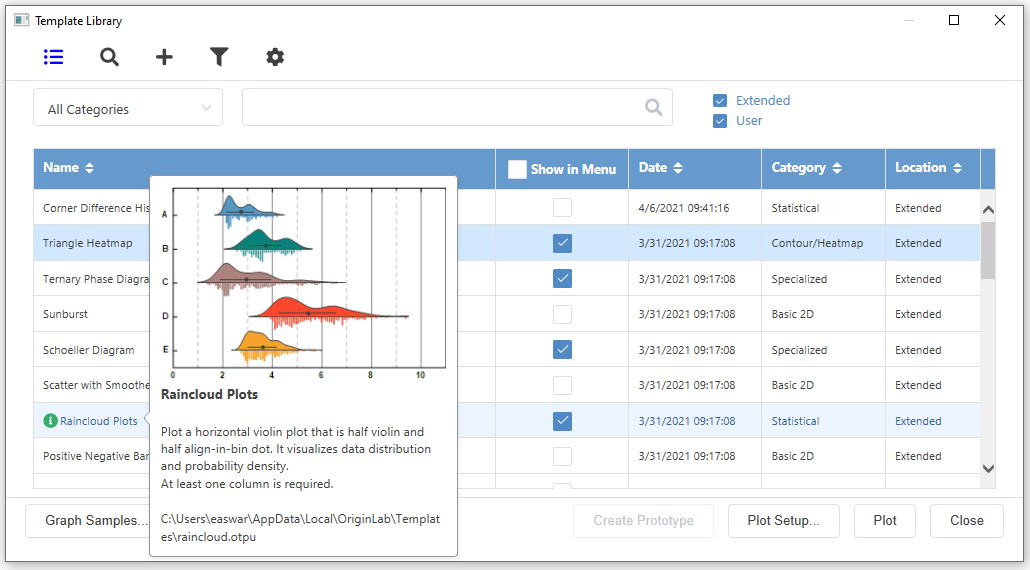
Graph Template Library dialog shown in List View mode
Data Slicer for Graphs
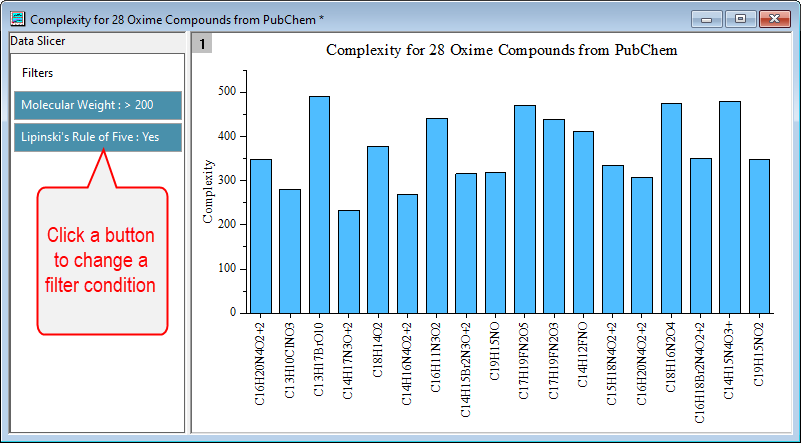
The new Data Slicer feature in OrginPro and Origin 2021 allows you to change filter conditions directly on a graph for easy data exploration. Simply set up filters on desired worksheet columns, create a graph with one or more layers, and turn on the Data Slicer panel to control the filters. Features include:
- Mini Toolbar to toggle Data Slicer panel
- Directly disable or enable filters from the graph
- Text filter has option for single entry allowing for easy switch of filter conditon
- Numeric filters allow several conditions including combinations with AND or OR
Improvements to Browser Graph
In OriginPro 2021b and Origin 2021b, several improvements have been made for Browser Graphs, including:
- Increased speed when selecting "All Columns from Same Sheet"
- Spawn new graph with selected plots
- Allow editing of metadata in navigation panel
- Several improvements to multi-layer browser graphs
- Explore image stack of multiple matrix objects using Browser Graph for Image, Contour or Profile plots.
New Graph Types
The following new graph types have been added in this version:
- Network Plots
- Grouped Marginal Plot
- Stiff Diagram
- Durov Plot
- Ribbon Chart
More information on the new Graph Types
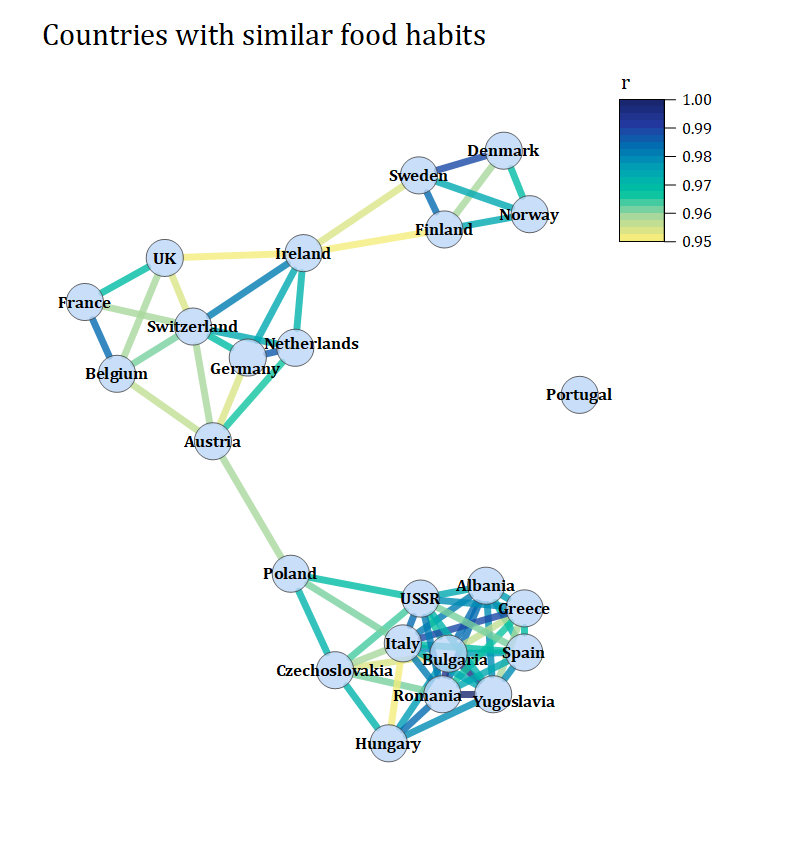
Network diagram of food preferences of countries
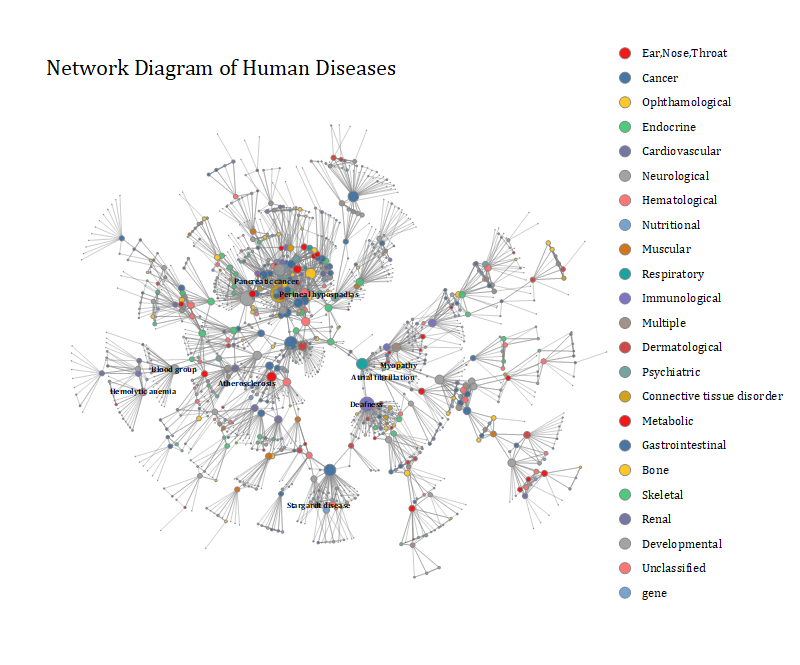
Network diagram of human diseases
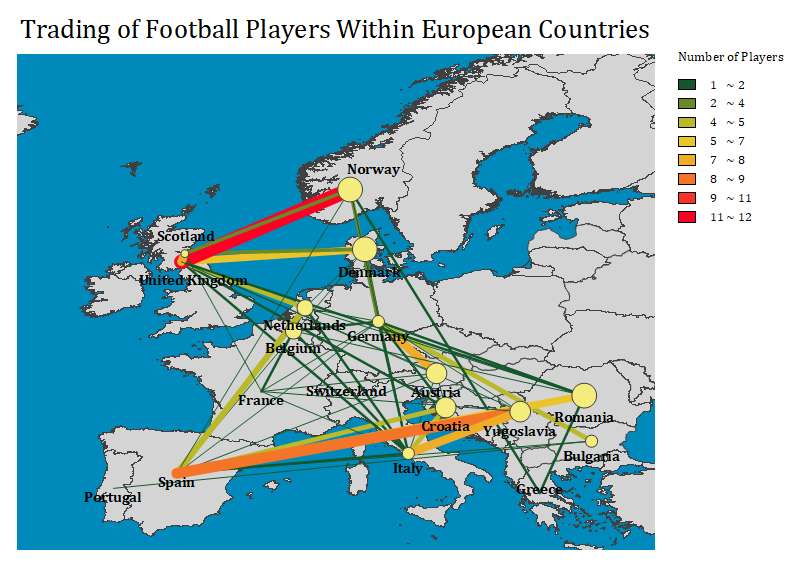
Network plot overlaid on map
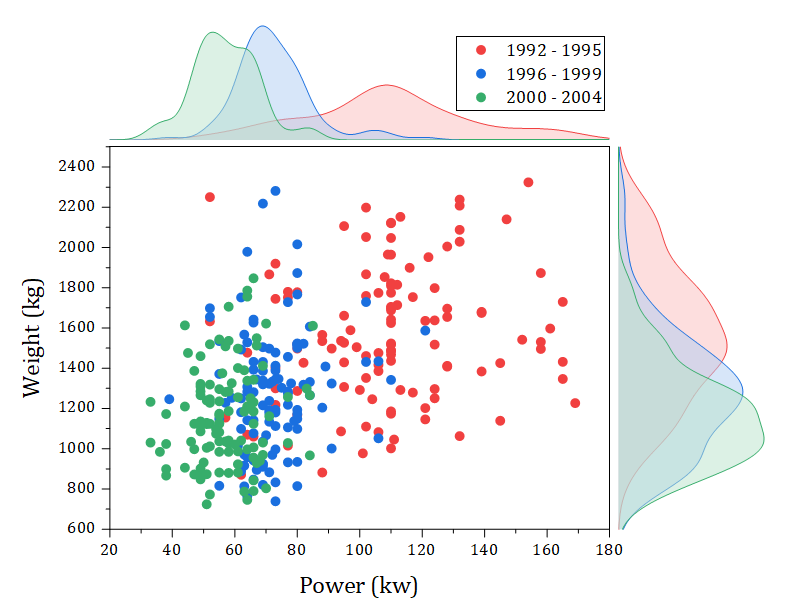
Grouped Marginal Plot with Distribution Curves. Top and right projections can be histograms, box plot, violins or distribution.
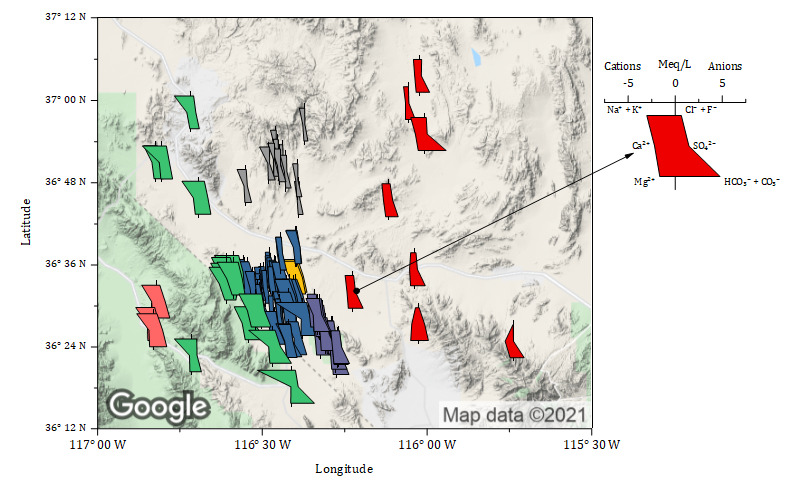
Stiff Diagram overlaid on Google Map
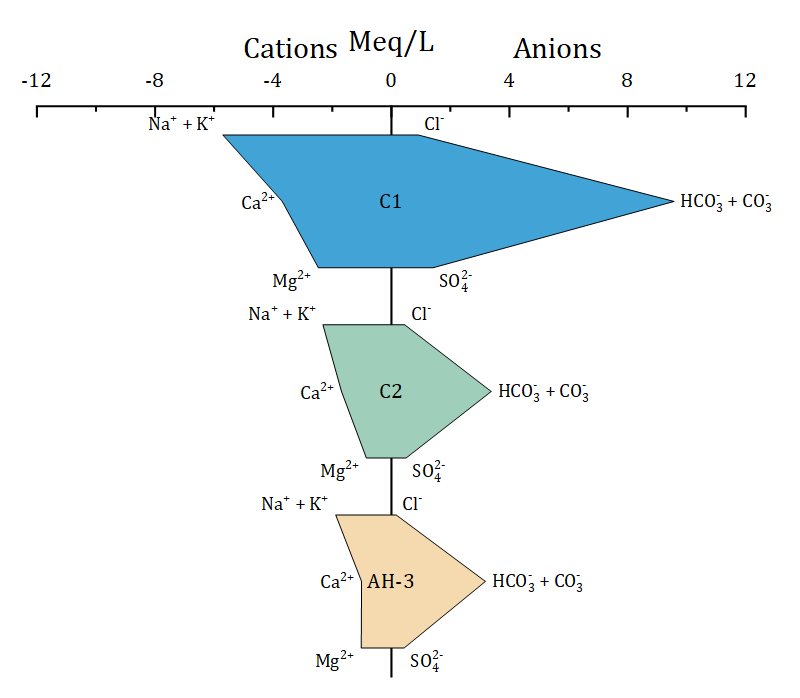
Stiff Diagram
Extended Graph Templates
Extended graph templates shipped with the product
In addition to new graph types available from the Plot Menu, OriginPro and Origin 2021b also include a set of extended graph templates. These templates are accessible from the new Graph Template Library dialog. The extended templates include:
- 3D Bars in Two Planes
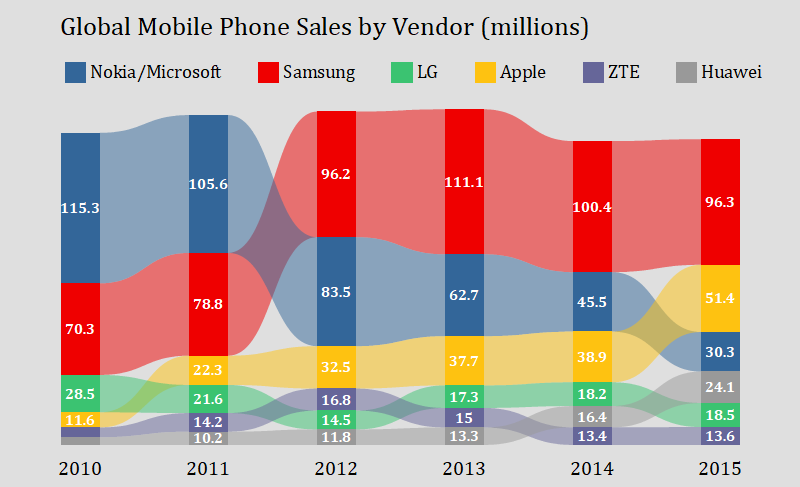
- Alluvial Plot from Summarized Data
- Anomaly Line Plot & Anomaly Plot
- Arrow Plot
- Corner Difference Histogram
- Ellipse Plot
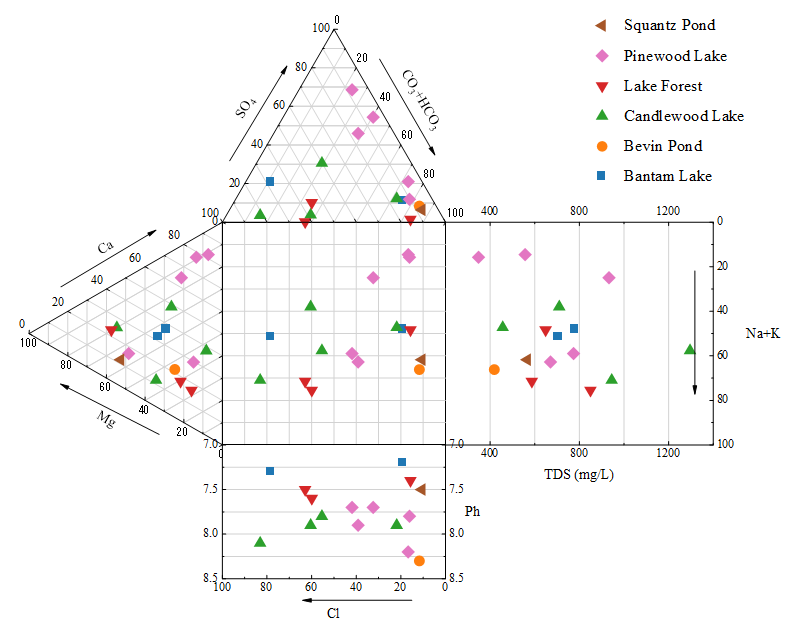
- Schoeller Diagram
- Stacked Lines by Custom Offsets
- Ternary Phase Diagram
- XY Error as Rectangles
Extended graph templates shipped with the product
New Apps
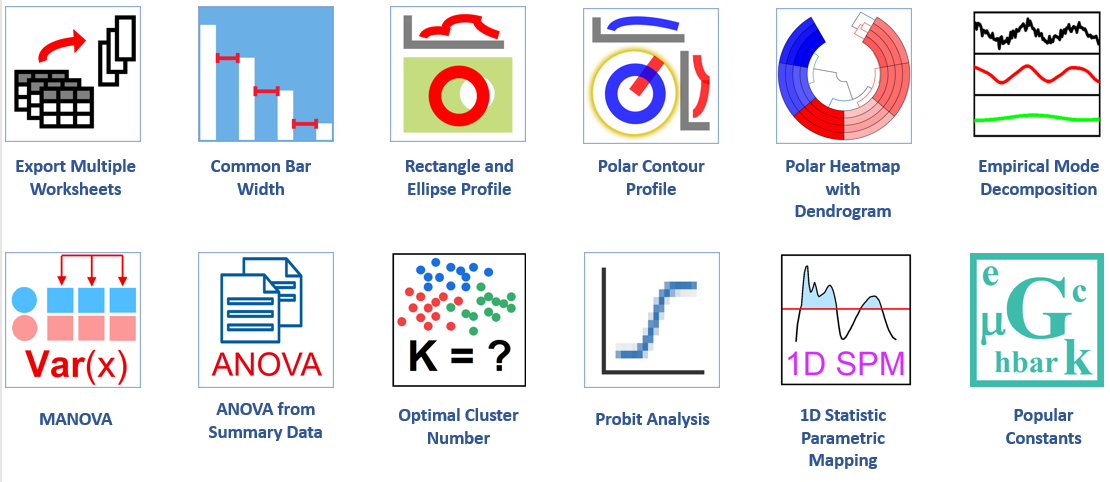
The following new Apps are available with OriginPro and Origin Version 2021b.
- MANOVA PRO
- Polar Heatmap with Dendrogram PRO
- Rectangle and Ellipse Profile
- Common Bar Width
- Export Multiple Worksheets
- Popular Constants
- Probit Analysis PRO
- ANOVA from Summary Data PRO
- Optimal Cluster NumberPRO
- Empirical Mode Decomposition PRO
- 1D Statistical Parametric Mapping PRO
- Polar Contour Profile PRO
- Shapefile-Konnektor
Other Features
General
- Easy way to unlock DC data
- Partial import in Excel Connector
- Simpler tool to export graph as image
- Merge Graphs to Layout page
- Group Plots Properties by Label Rows
- Keep last autosaved project file Last-AutoSave.opju
Data Manipulation
- Mini Toolbar to extract Units from Long Name
- More context menu for Data Filter icon
- Extend day limitation for hours in Time Format
- Freeze beginning columns or rows in Worksheets
- Append Worksheet supports append to the last row of each column
- Convert subregion of worksheet to XYZ columns
- Expand matrix dimension when pasting data
Analysis
- Mini Toolbar to add Linear Fit curve to plot
- Toolbar button to pause Recalculation
- Duplicate this operation
- Batch Peak Analysis using multiple instances
- Gadget output to clipboard
- Arbitrary shape ROI box in Cluster gadget