


New in OriginPro 2022b and Origin 2022b
No trial version yet?
OriginPro and Origin 2022b offer the following new features:
- Export Graphs and Layouts as SVG Format
- Buttons for Workbook Organizer and New Sheet
- Arrange Windows with Custom Sorting, and Snap Windows
- Origin Rich Text Syntax for Notes Windows
- Rich Text Support for Worksheet Cell Notes
- Insert Images into Graphs and Notes
- Working with GeoTIFF Files
- Simplified Symbol Map Dialog
- Distance Annotation on Graphs
- Named Range Support for Label Rows and in Regression Dialogs
- Remove Formula/Links to easily share Project with others
- Adjust Icon Spacing in Apps Bar
- New Graph Types
- New Apps
- Other Features
Export Graphs and Layouts as SVG Format
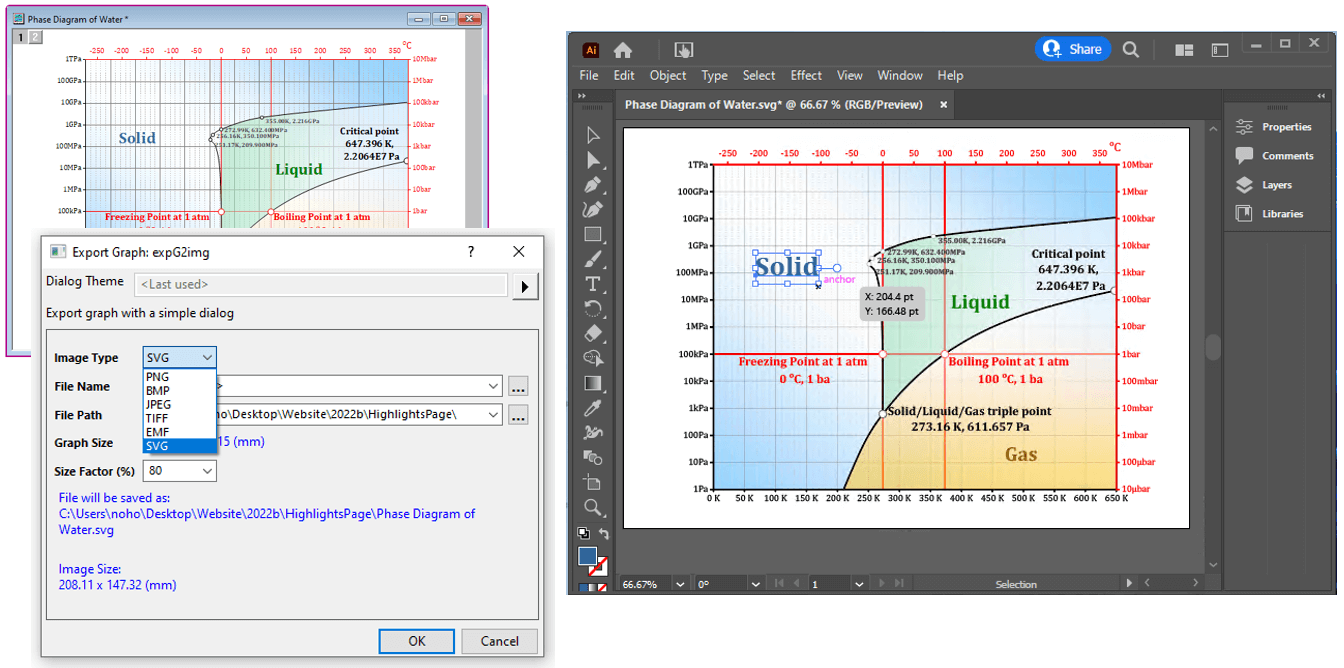
In OriginPro and Origin version 2022b, graphs and layouts can now be exported in SVG format, allowing for easy editing of the exported file in applications such as Adobe Illustrator to create your final manuscript.
Buttons for Workbook Organizer and New Sheet
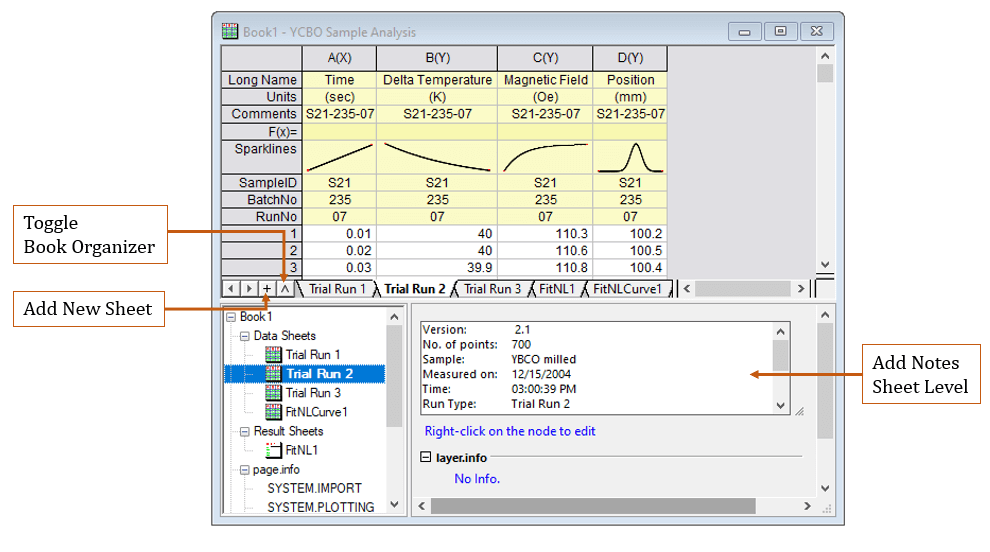
Workbooks have the following improvements in version 2022b of OriginPro und Origin:
- Toggle Book Organizer panel on/off with button
- Button to add New Sheet
- Add notes at any Sheet Level in Organizer
Arrange Windows with Custom Sorting, and Snap Windows
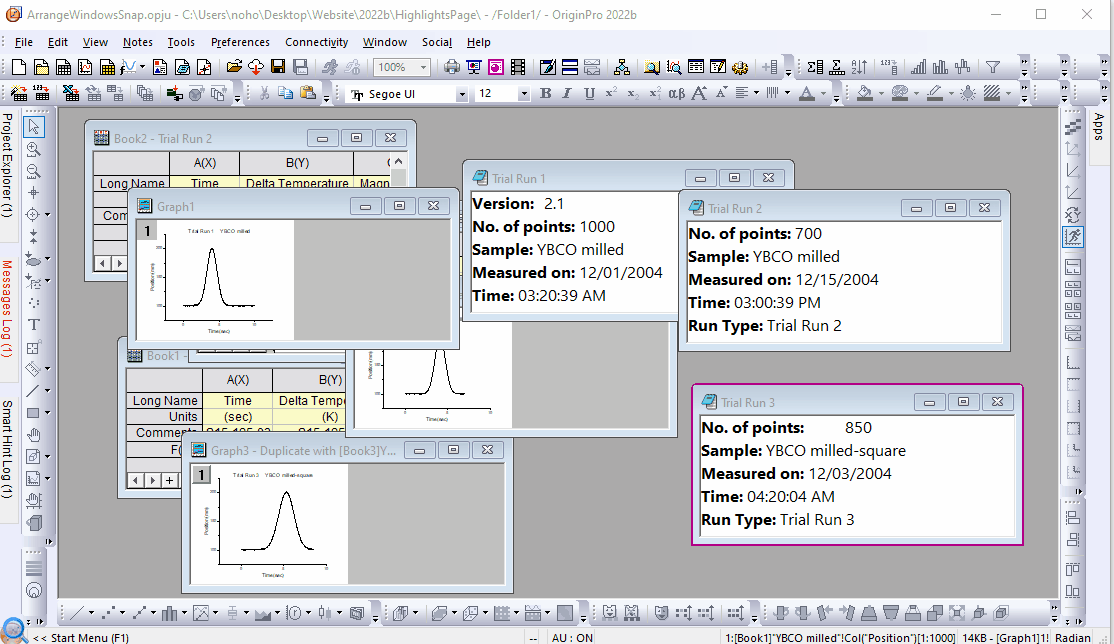
In OriginPro and Origin 2022b, there is a new dialog to arrange and tile windows with several options including
- sort by name, type, offset etc.,
- snap windows,
- drag, resize related windows using grab bars.
Origin Rich Text Syntax for Notes Windows
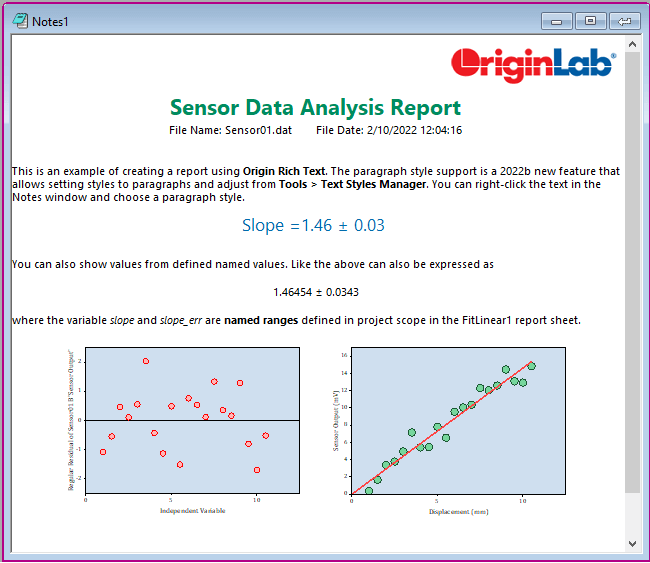
Notes windows support Origin Rich Text syntax in OriginPro and Origin 2022b. The following features are supported:
- Rich text supported in stand alone Notes Window or Notes Sheet added to workbook
- Perform quick formatting by selecting text and clicking buttons such as Bold and Symbol
- Apply Text Styles such as Heading Body Text, Bullet List, Numbered List etc.
- Customize or add your own styles
- Auto Wrap supported
- Insert Table
- Insert LaTeX equations (MiKTeX required)
- Link text to web pages, LabTalk commands and more
Rich Text Support for Worksheet Cell Notes
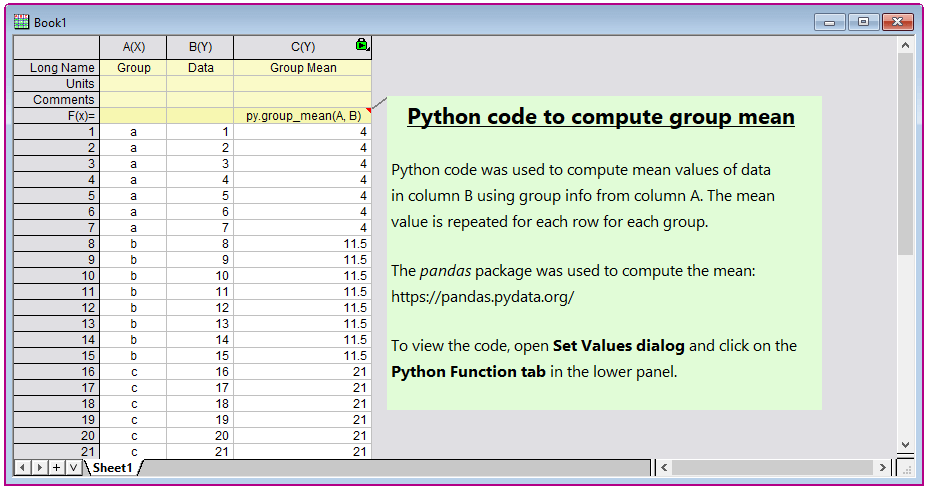
Notes added to cells now support Rich Text in version 2022b:
Insert Images into Graphs and Notes
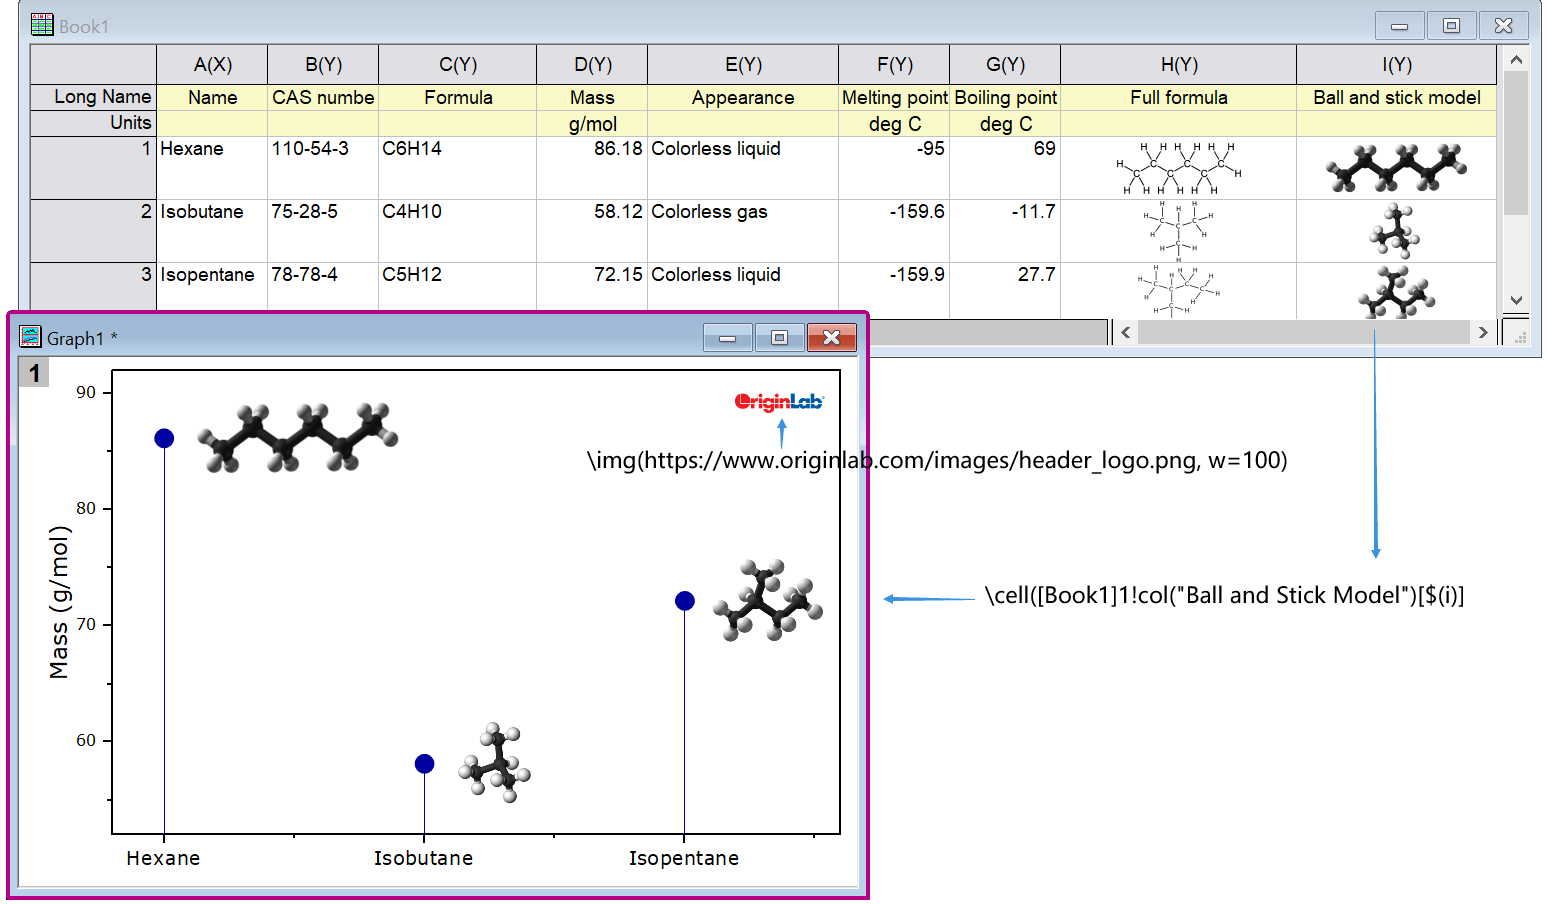
Use the new \img(notation) to link online image into graph labels. Use the new \cell(notation) to insert images embedded in worksheet cells into graph labels.
New notation has been introduced to insert image to labels in graph to reduce project file size in OriginPro and Origin 2022b. The same notation is used to insert image in notes window with Origin Rich Text format.
- Insert image from image window
- Insert image from worksheet cell
- Insert image from disk
- Insert image from web
Use the new \img(notation) to link online image into graph labels. Use the new \cell(notation) to insert images embedded in worksheet cells into graph labels.
Working with GeoTIFF Files
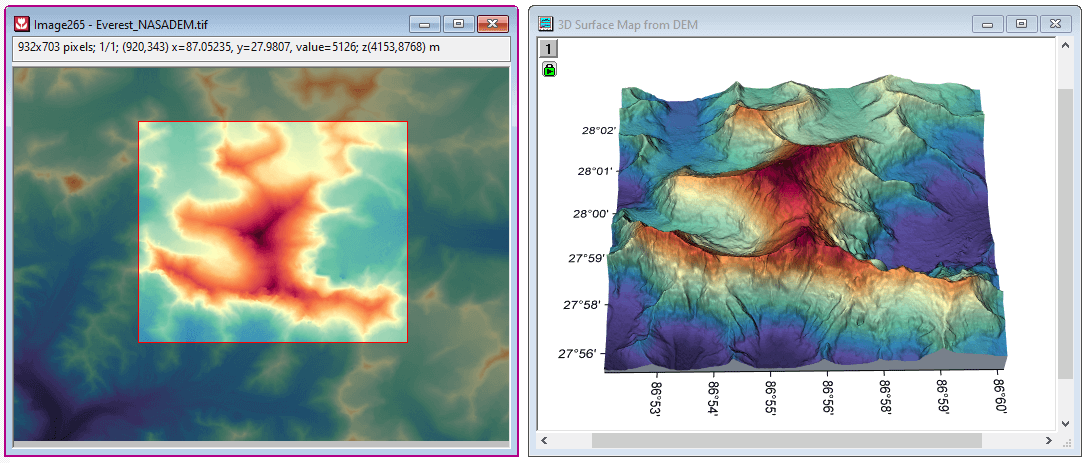
Add one or more ROIs on your imported GeoTIFF image, and extract to analyze further or create graphs such as 3D surface plot. Moving or resizing the ROI will automatically update the analysis results and graphs
Support for GeoTIFF files has been added to OriginPro and Origin 2022b:
- Import and export GeoTIFF files
- Set grayscale display range
- Set Region of Interest to create graphs
- Calculate grayscale histogram
- Convert pixel value to matrix or column
Add one or more ROIs on your imported GeoTIFF image, and extract to analyze further or create graphs such as 3D surface plot. Moving or resizing the ROI will automatically update the analysis results and graphs
Simplified Symbol Map Dialog
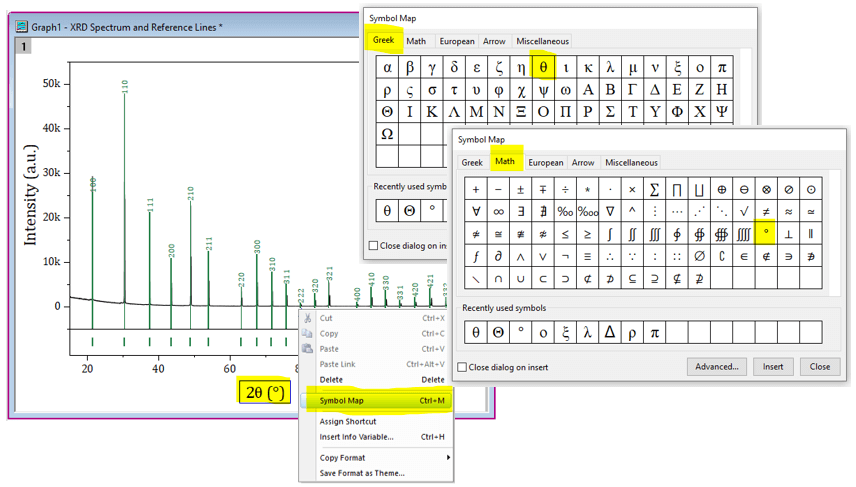
A simplified "Symbol Map" dialog has been introduced in version 2022b, with multiple tabs with commonly used and popular symbols. The dialog also displays a list of symbols recently used from any tab, for quick access. "Tools > Special Default Fonts" dialog is provided to set default fonts for different symbol groups.
Distance Annotation on Graphs
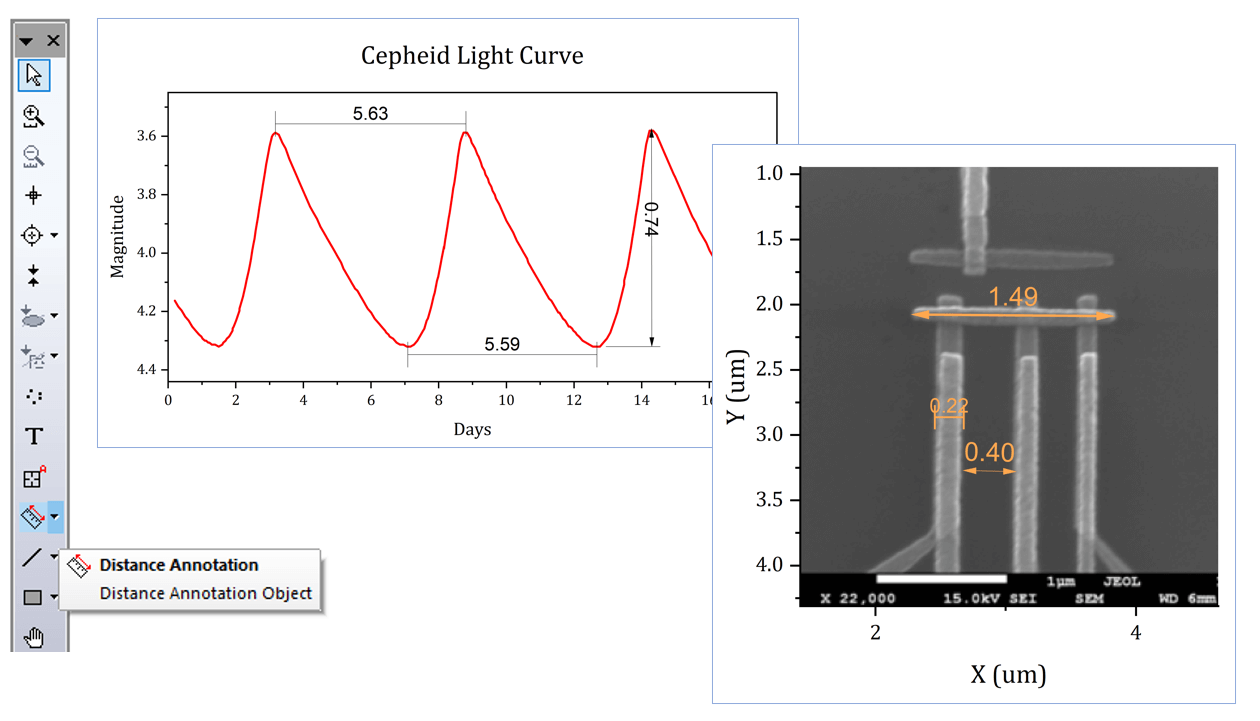
The Distance Annotation toolbar button lets you add horizontal, vertical or diagonal distance measurement annotations to your 2D and Image graphs.
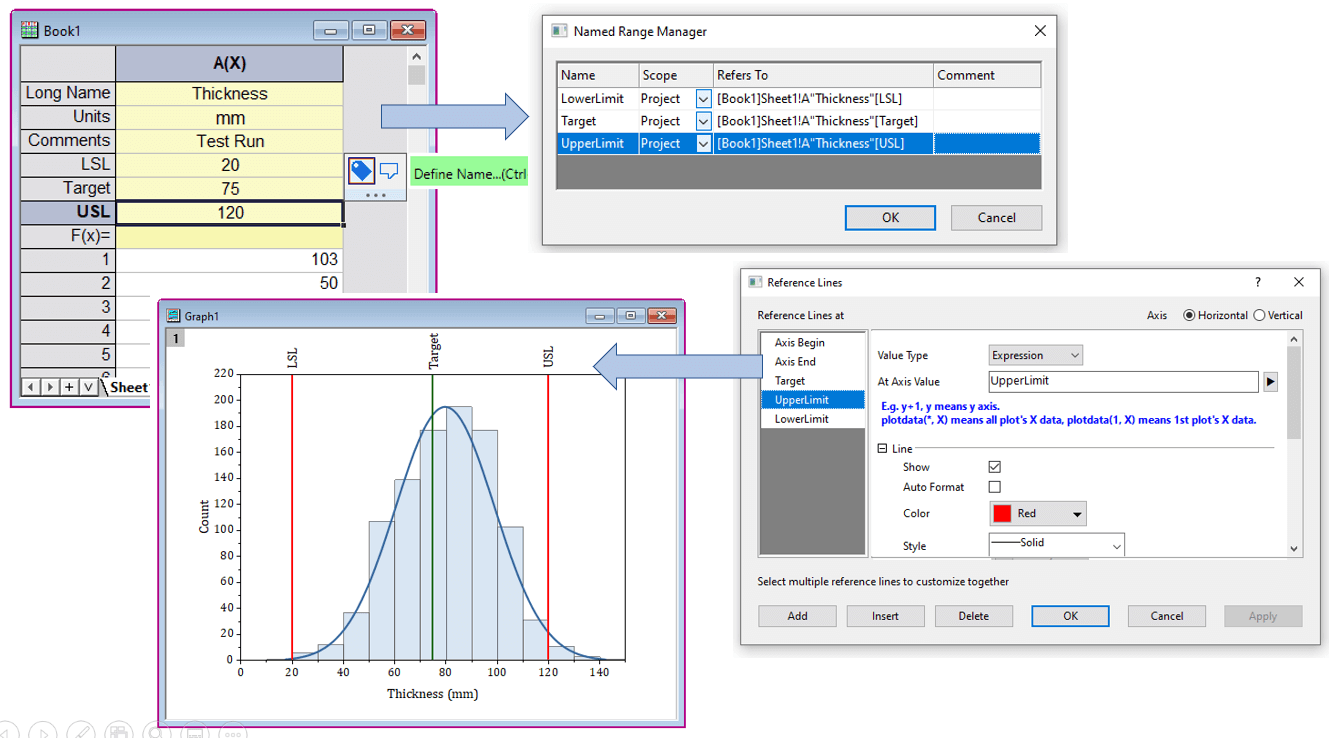
Named Range Support for Label Rows and in Regression Dialogs
The scope of named range has been expanded in version 2022b:
- Define named ranges for values stored in column label rows. Then use those names in calculations, or to set reference line locations in graphs.
- Use named ranges for setting fixed parameters and bounds to control linear and non-linear fitting operations
Remove Formula/Links to easily share Project with others
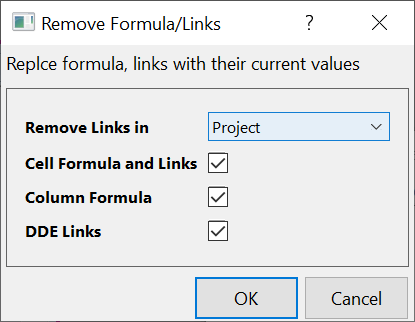
In OriginPro and Origin 2022b, a new dialog has been introduced that allows you to remove formula and links from your Origin project file before sharing with colleagues.
Adjust Icon Spacing in Apps Bar
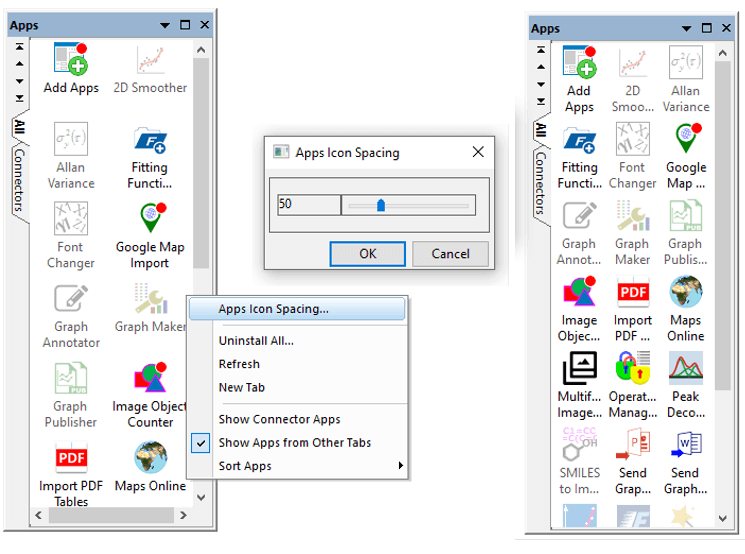
You can now adjust the spacing between icons in the App bar to allow displaying more icons in OriginPro and Origin 2022.
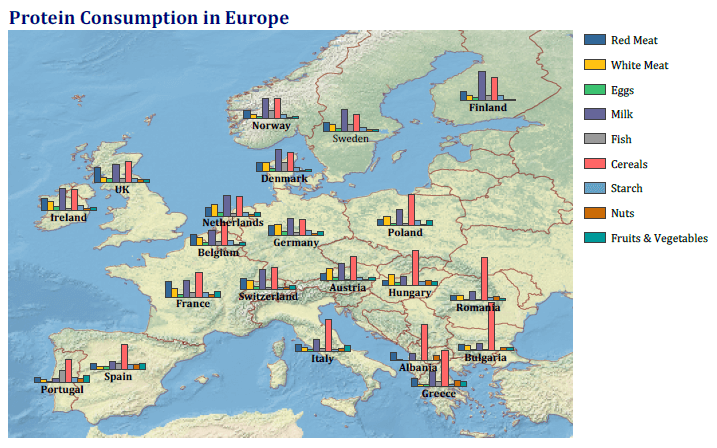
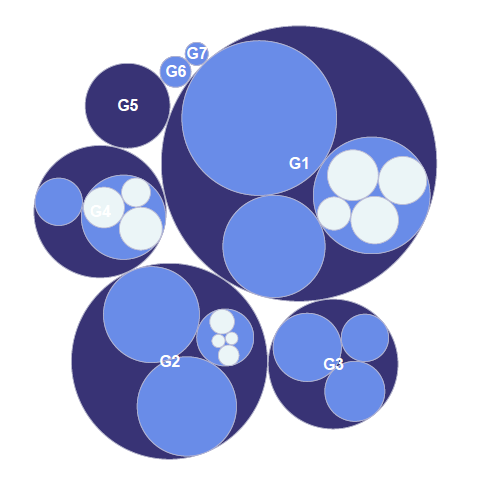
New Graph Types
The following new graph types have been added in version 2022b:
- Bar Map Plot
- Spiral Bar Chart
- Circular Packing Graph
- Right-Triangle Ternary Plot
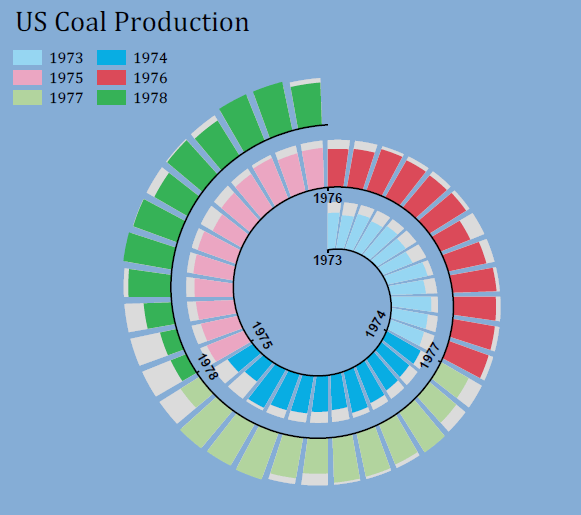
Spiral Bar Chart
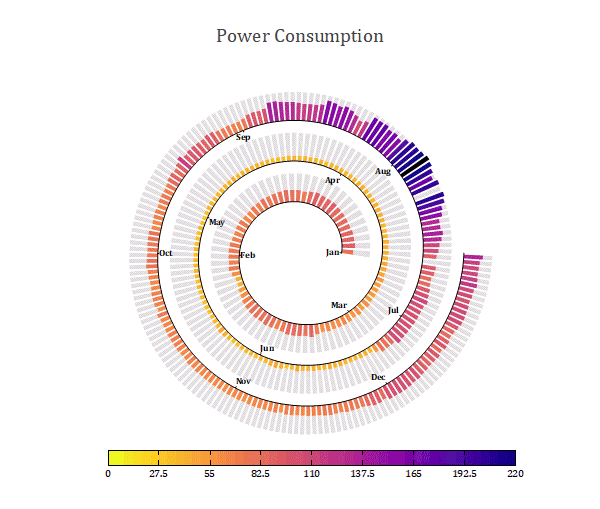
Spiral Bar Chart with Colormap
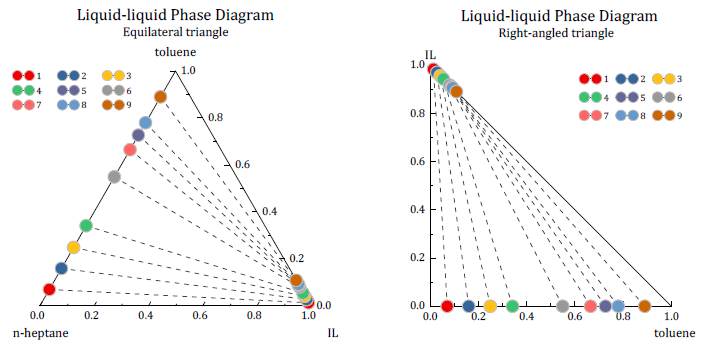
Right-Triangle or Equilateral-Triangle Ternary Plot
New Apps
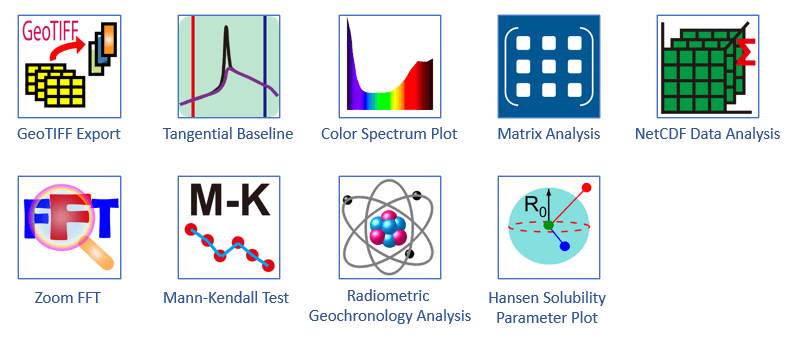
The following new Apps are available with this latest version of OriginPro and Origin.
- GeoTIFF Export
- Tangential BaselinePRO
- Color Spectrum Plot
- Matrix AnalysisPRO
- NetCDF Data AnalysisPRO
- Zoom FFTPRO
- Mann-Kendall TestPRO
- Radiometric Geochronology AnalysisPRO
- Hansen Solubility Parameter Plot
Other Features
General
- Scale window size when project opened in monitor with different resolution
- Hot Key and button to Pause Recalculation
- Enable Project Explorer Pop-up only on CTRL key
- Ctrl+Z to restore deleted workbook window
- GeoTIFF import & export, grayscale histogram, set grayscale display range, etc.
- Improvements of NetCDF import
- Import web image
- Paste or import merged cells from Excel
Graphing
- Dash line customization
- Show unique Entries only in Point by Point legend.
- Longer minus sign in tick labels
- DPI option in Export Image dialog
- Mini toolbar for multiple legends
- Add labels for multi-layer graph
- Collect data from different sheets with Data Highlighter
- Hide Speed Mode Banner on graph page mini toolbar
- Much faster scatter plot with drop lines by setting symbol size to 0
Data Manipulation
- Better handling of duplicate long names in Column Formula
- Add tolerance when splitting worksheet with reference value
- Case sensitive column long name in LT calculation
- Custom labels above Gadget box
- Refill matrix with missing values for boundary shape
- Normalize columns by custom range or range of reference column
- More interpolation options for NetCDF matrices
- NetCDF Data Period arithmetic calculation on matrix