


![]()
New in Origin/OriginPro 2015
The following sections highlight some of the new features for Origin 2015.
Ease of Use
Ease of Use
User Interface
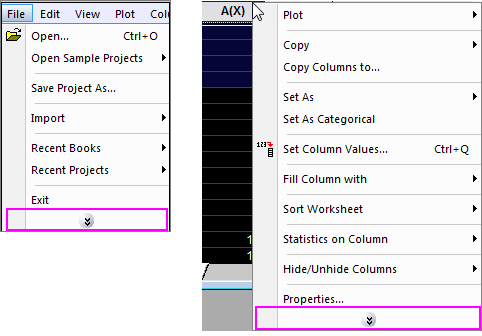
Collapsible Menu & Context Menu
Origin 2015 introduces MS Office Style Collapsible Menu for some very long menus and context menus so only commonly used ones show by default. Users can access items not frequently used via the double down-arrow at the bottom of the menu.
Project Explorer
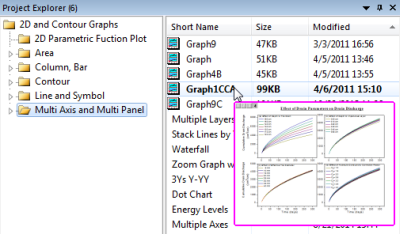
Graph Preview in Project Explorer
The Project Explorer in Origin was designed to provide easy control of hierarchy project structures. In Origin 2015 it has been improved with nicer interface and find & search functionality:
- View in Extra Large Icons
- Graph Preview and Tool Tip
- Find String Anywhere in Project
Set Column Values
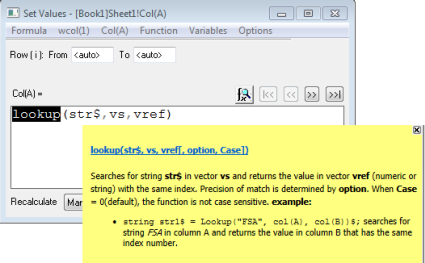
Function Tool Tip in Set Column Value Dialog
The Set Column Values dialog is one of the most basic tool in Origin, which is used to carry out column-based calculation with formulas. In 2015 it is highly improved with more intuitive tool tip and function help:
- Search and Insert Functions
- Tool Tip for Function Syntax
Graphing and Analysis
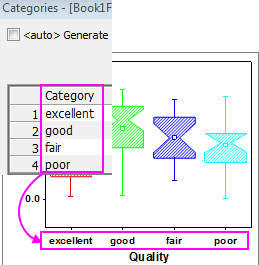
Using Categories Data to Control Grouped Box Chart
In Origin 2015, many improvements are targeted to provide easier and user-friendlier control options with both graphing and analysis:
- User-Defined Order for Categorical Data - Order Used for both Graphing and Analysis
- Colored Pairs of Parentheses in Function Formula
- Batch Plotting in 3D and Contour Graph
Graphs
Graph Customization
- Axis Dialog has been redesigned (again) to make it more like the original.
- Legend Improvements
- New Bubble Scale
- Enhanced Colormap Scale
- Categorical Legend
- Improved Contour Plot Boundary
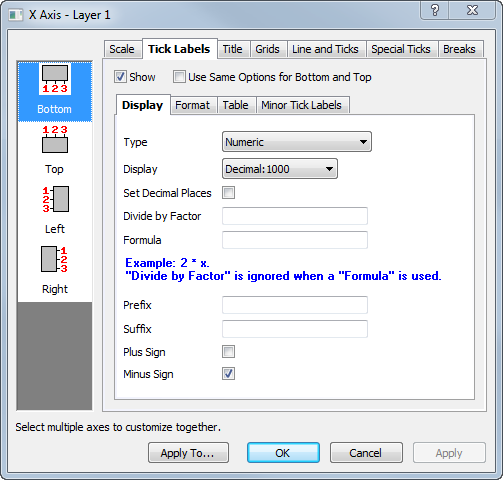
Improved Axis Dialog |
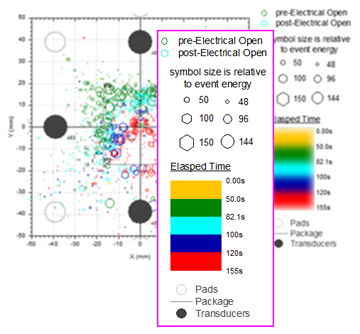
Improved Scale Object (Bubble and Color Scale) |
Graph Types
- Column Scatter
- Heat Map
- Kernel Density Plot
- Improved Profile Plot
- Custom Percentile & Jitter Points in Box Chart
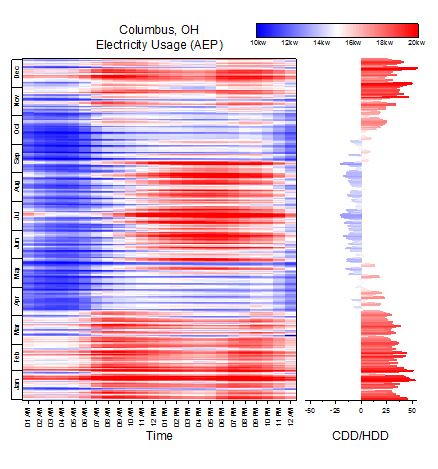 Heatmap |
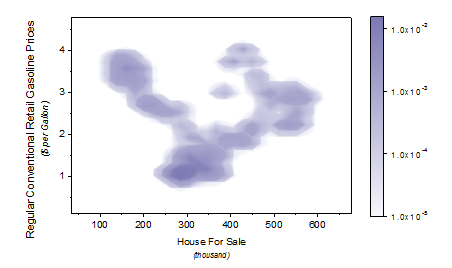 Kernel Density Plot |
Analysis & Statistics
Analysis and Statistics
- Distribution Fit
- RMANOVA with Unbalanced Data
- t-Test on Rows
- Share 6 OriginPro features with Origin
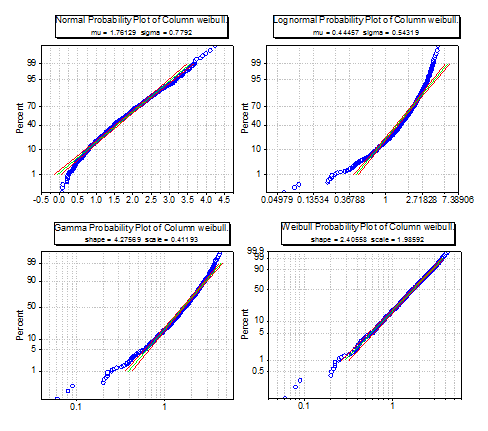 Distribution Fit |
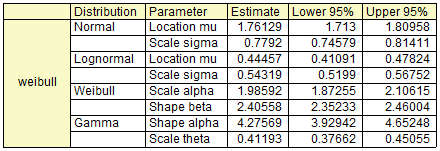 Distribution Fit |
Data Management & Import
Data Management
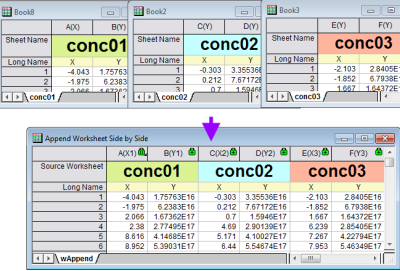
Append Worksheet Side by Side
- Append Worksheets
- Remove/Combine Duplicate Rows
- Pivot Table with Multiple Source Rows/Columns
Import
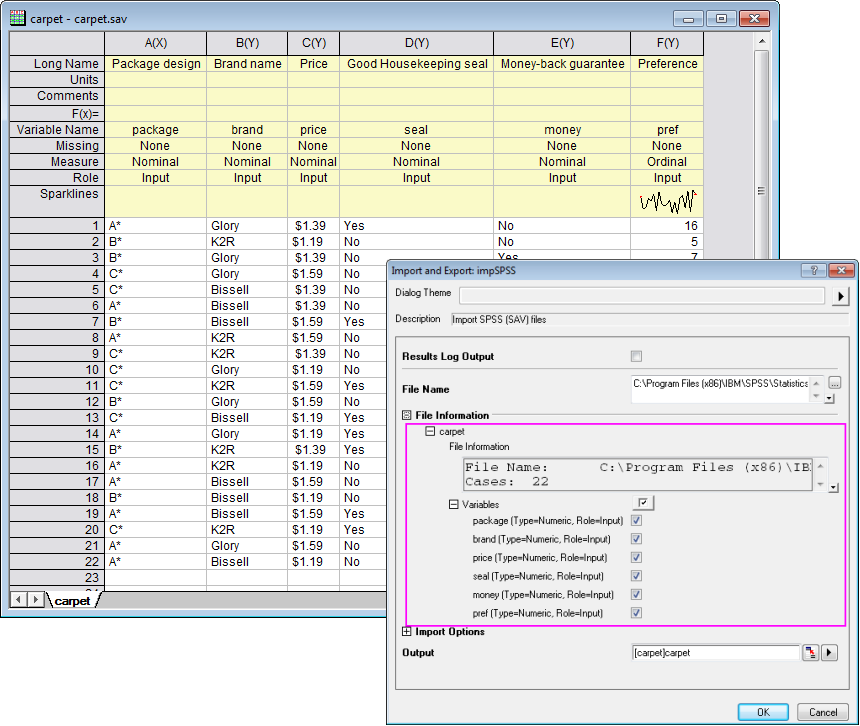
Import SPSS File
- Import Transposed Matlab Data
- SPSS File Import
- Extract Long Name and Units from Same Line
Programming
Programming
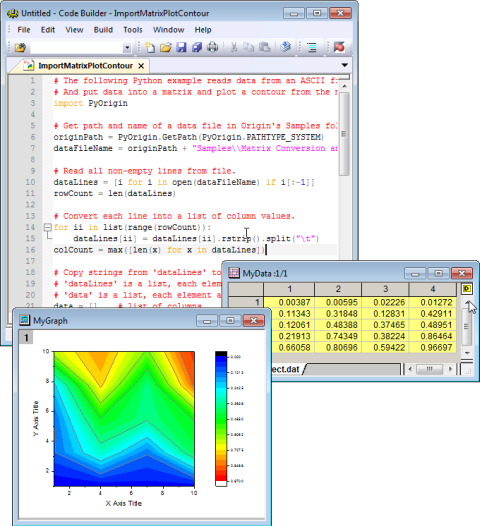
Using Python to Import Data to Matrix and Create Contour Plot
- Working with Python.