


New in Minitab 20 Flyer
Download FlyerNew in Minitab 20.4, 20.3, 20.2 and 20.1
Since November, 1st 2020, Minitab LLC only offers Minitab 20 (full version) for rental with the named user model. The Minitab full version consists of Minitab Desktop (known from previous versions) and the Minitab Web App (Minitab in the Cloud).
Short Overview of new features in Minitab 20.4
- additional visualization Bubble Plot in Graph Builder.
- Optional chargeable Healthcare Module
New optionalchargeable Healthcare Module in Minitab 20.4
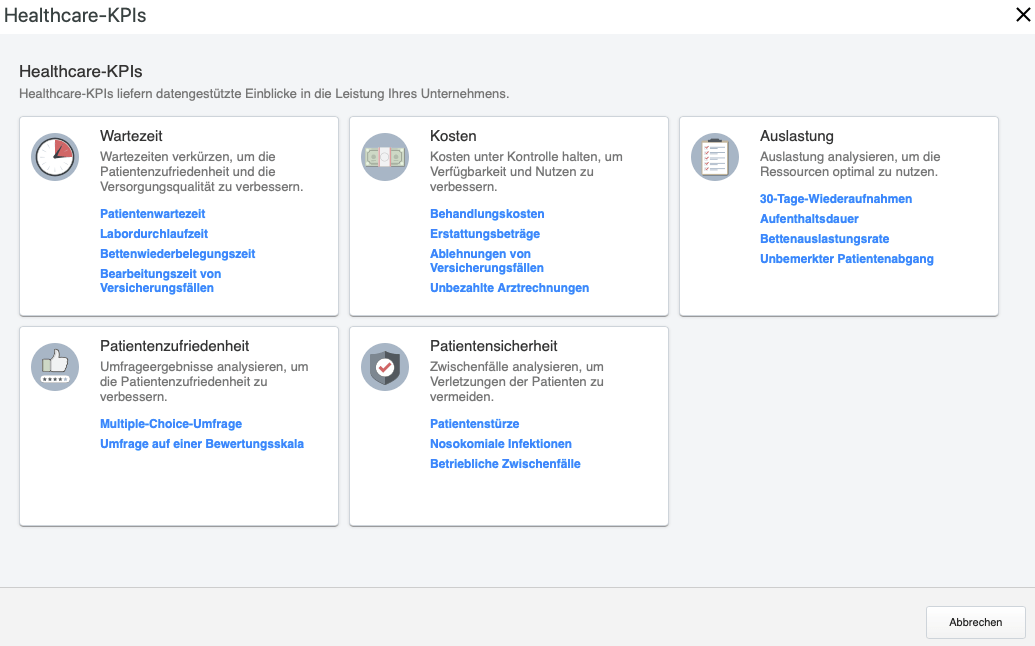
The optional chargeable Healthcare Module in Minitab 20.4 offers guided data analysis using common healthcare terms and is specifically designed for healthcare professionals. With the module, healthcare professionsl can focus on improvements in key performance indicators (KPIs) such as wait time, cost, utilization, patient safety and satisfaction instead of learning statistics to choose the right analysis method.
Mehr zum Minitab-Modul "Healthcare"
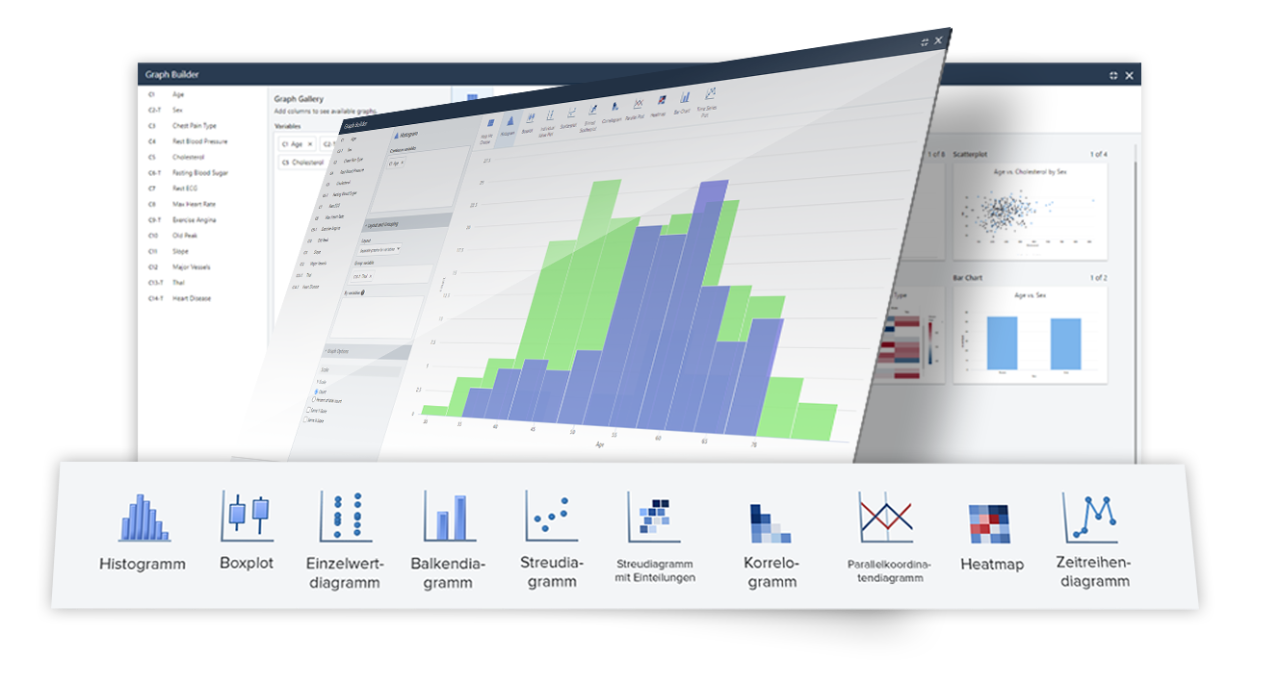
New "Graph Builder" in Minitab 20.3
With its interactive and easy-to-browse gallery, the new Graph Builder in Minitab 20.3 allows users to move seamlessly from one graph to the next, using the same data each time. This eliminates the need to re-run analyses, allowing users to focus on selecting the most effective representation of their data and results.
Short Overview of new features in Minitab 20.2
- Correlogram for visual comparison of Pearson correlation coefficients between each pair of variables
- Enhancements for variable weighting in CART® classification and CART® regression
- Enhancements for scatter plot, heat map and parallel coordinate plot
- R Integration
- Optional chargeable Predictive Analytics Module including TreeNet® classification, TreeNet® regression, Random Forests® classification and Random Forests®regression
Correlogram
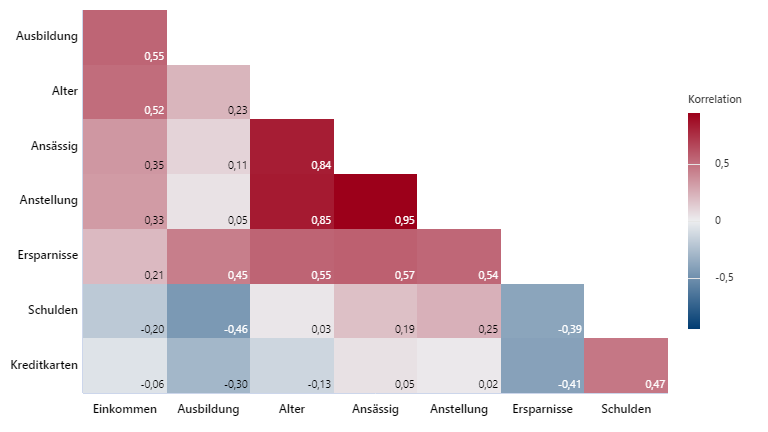
The new correlogram in Minitab 20.2 can be used to visually compare Pearson correlation coefficients between pairs of variables. Minitab 20.2 uses a color gradient to indicate low and high correlation coefficient values, making it easy to identify the most and least important relationships.
R Integration
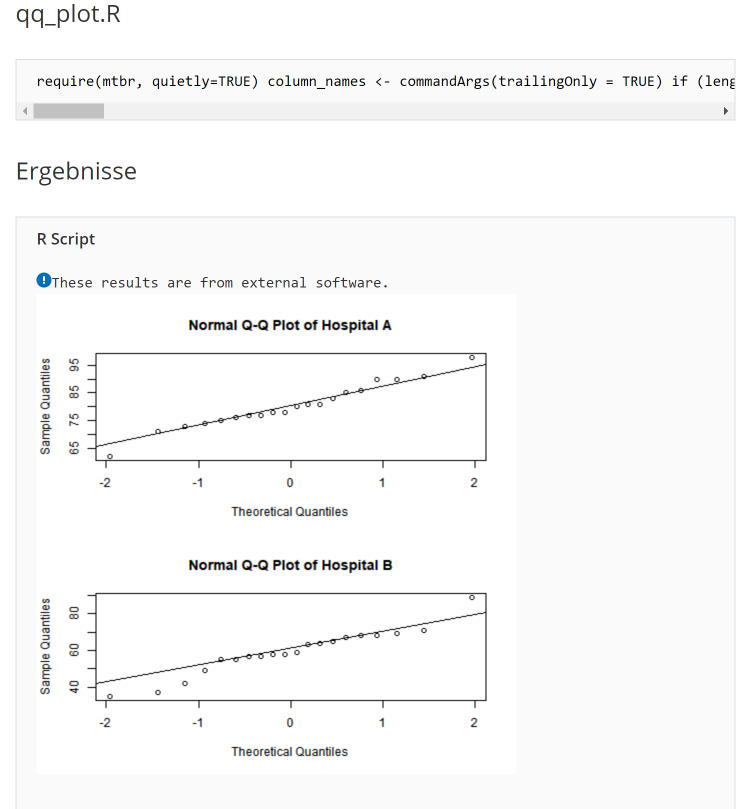
Minitab 20.2 allows you to call R scripts from Minitab, passing data from Minitab to R. The results are returned from R to Minitab and displayed in the Navigator or the Output window.
More information on R Integration in Minitab
Predictive Analytics – optional, chargeable Add-On Module
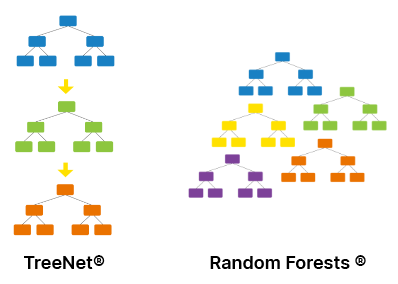
The chargeable additional module 'Predictive Analytics' enhances Minitab with machine learning algorithms, TreeNet® and Random Forests®. Tree-based methods map non-linear relationsships quite well.
The TreeNet® modeling engine's level of accuracy is usually not attainable by single models or by ensembles such as bagging or conventional boosting. The TreeNet methodology is not sensitive to data errors and needs no time-consuming data preparation.
Random Forests®' strengths are spotting outliers and anomalies in data, displaying proximity clusters, predicting future outcomes, identifying important predictors, discovering data patterns, replacing missing values with imputations, and providing insightful graphics.
More information on the Minitab Module "Predictive Analytics"
Short Overview of new features in Minitab 20.2
- Minitab will be delivered to new custormer as the full version consisting of the Desktop and the Web App.
- The Minitab Web App requires no installation, just a compatible web browser ( System Requirements).
- New: Report Tool for reports with linked data and graphics for documentation
- Enhancement of the CART technologies for data mining by new model selection for classification and regression trees
- Model validation for Binary Logistic and Poisson regression
- Update: Variability Chart
- New: Parallel Coordinates Plot
- Neu: Binned Scatterplot
- New: Heat Map
- The Mac version is no longer available, the functionality of the Minitab Web App is very similar to this version.
From anywhere on the Cloud
- Access from nearly any device
- Minitab now delivered as both desktop application and new web application
- Share projects with a single click
- Data Access and store from Google Drive™, Microsoft OneDrive® or local files
- Single user sign-on available
- Named-User rental via Cloud
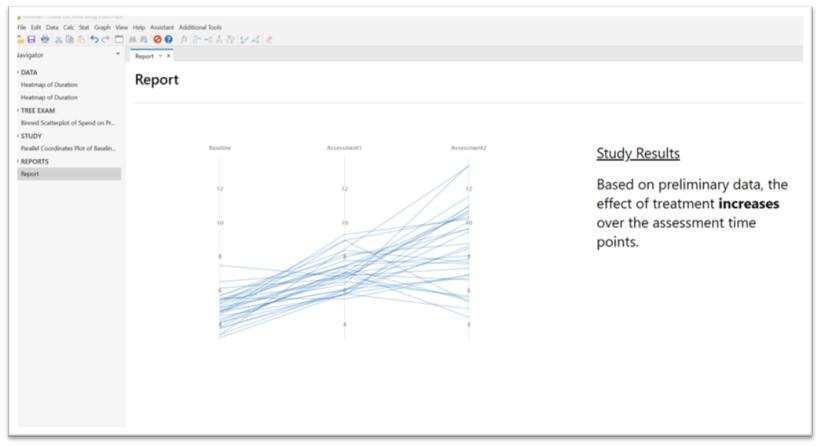
Reports with the Report Tool
Minitab 20 includes a Report Tool for writing simple project reports containing linked data and graphics. Objects can be moved with the mouse.
Reports can be created and viewed directly in a Minitab project file, making it easier for users to organize their results. Reports are customisable and support the aggregation and curation of live-linked Minitab tables and graphs. Users can also add annotations to a Report.
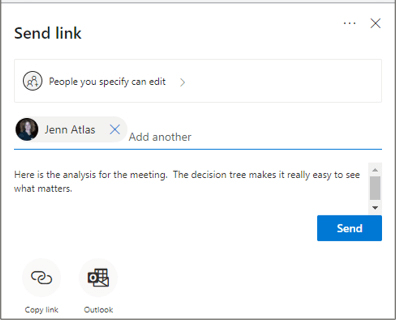
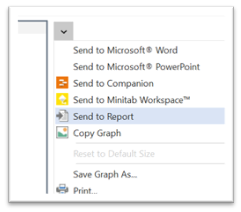
Reports are easily discovered in the Navigator. With a single click, users can send to Microsoft Word, Microsoft PowerPoint, or Minitab Workspace.
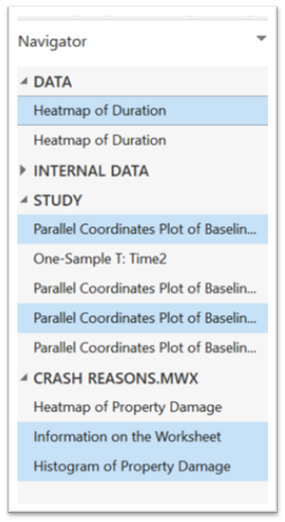
Multi-Select in the Navigator
The Navigator in Minitab 20, which was introduced with Minitab 19.1, offers the ability to select multiple items from the Navigator. Selecting a range of output makes it easier for users who need to remove or send output from the Navigator.
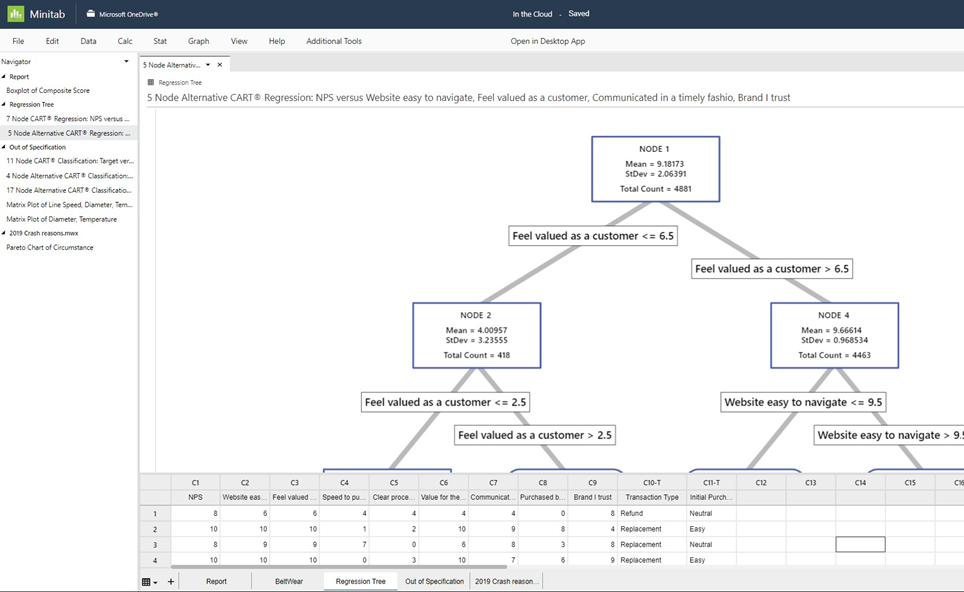
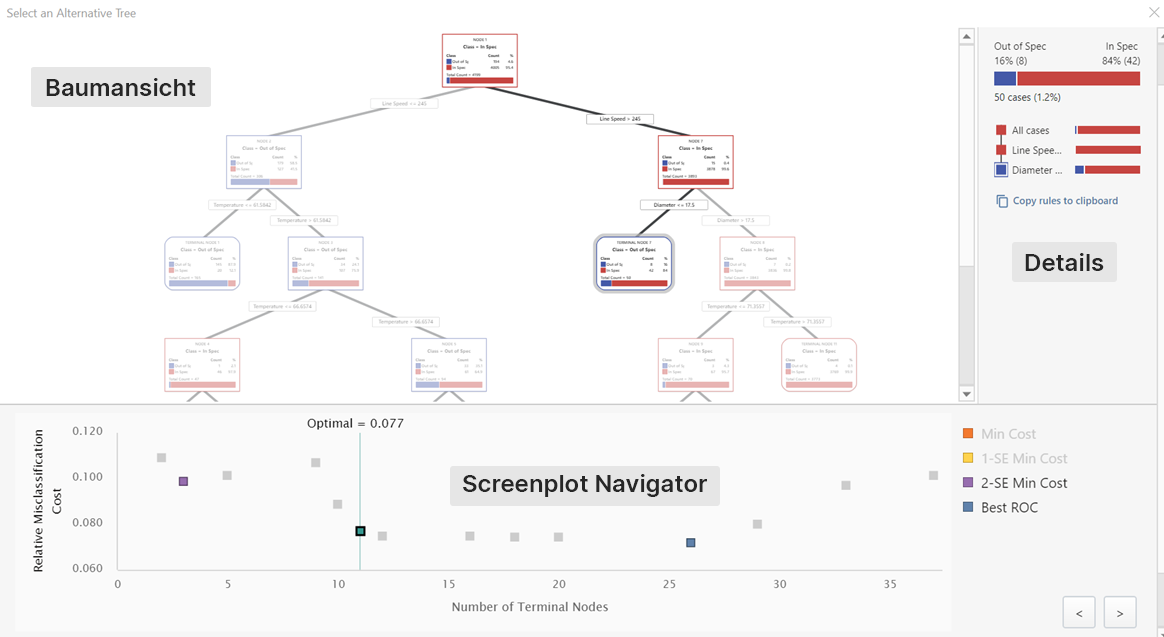
Model Selection for Classification and Regression Trees
When evaluating alternate models in Minitab 20, users have an all-in-one view of the decision tree, scree plot and node details.
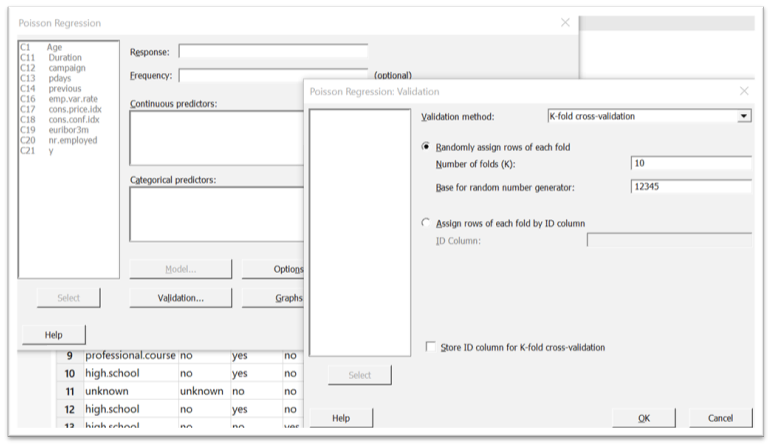
Model Validation in Binary Logistic Regression and Poisson Regression
In Minitab 20, model validation is available in Binary Logistic and Poisson Regression. Validation is the process of evaluating a trained model on a test data set. This feature makes it easier for users to create useful models.
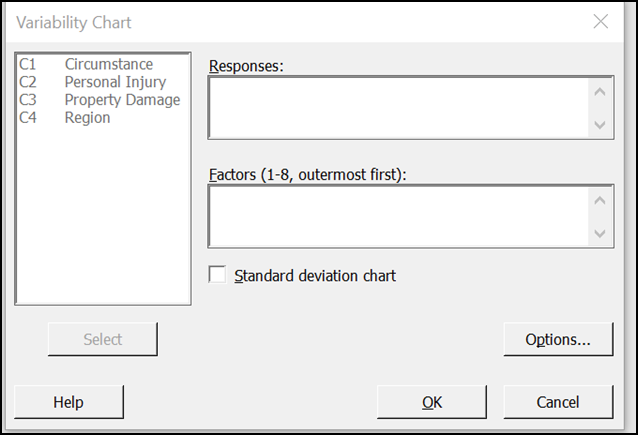
Variability Chart
Two improvements are added in Minitab 20 to the chart that was introduced in Minitab 19.2:
- The ability to specify multiple response variables for a given set of factors – this results in multiple graphs, one for each response.
- The ability to brush individual observations.
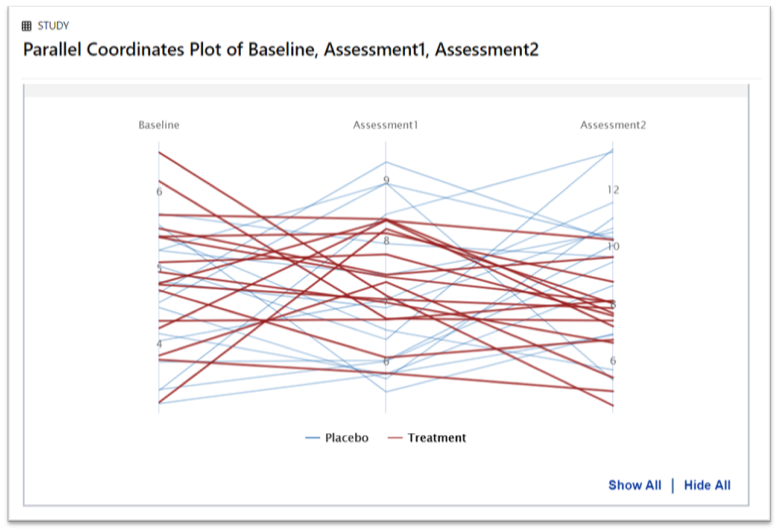
Parallel Coordinates Plot
The new parallel coordinates plot in Minitab 20 displays multivariate numerical data, making it easy to visualise multiple dimensions.
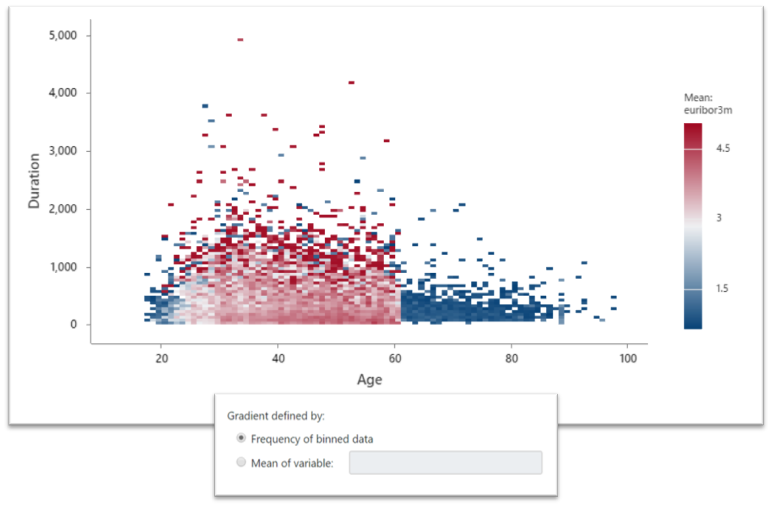
Binned Scatterplot
In Minitab 20, a new binned scatterplot is introduced, which is a visual to display the relationship between two continuous variables when the dataset contains many observations. The gradient can be defined by observation frequency or by the mean of another variable.
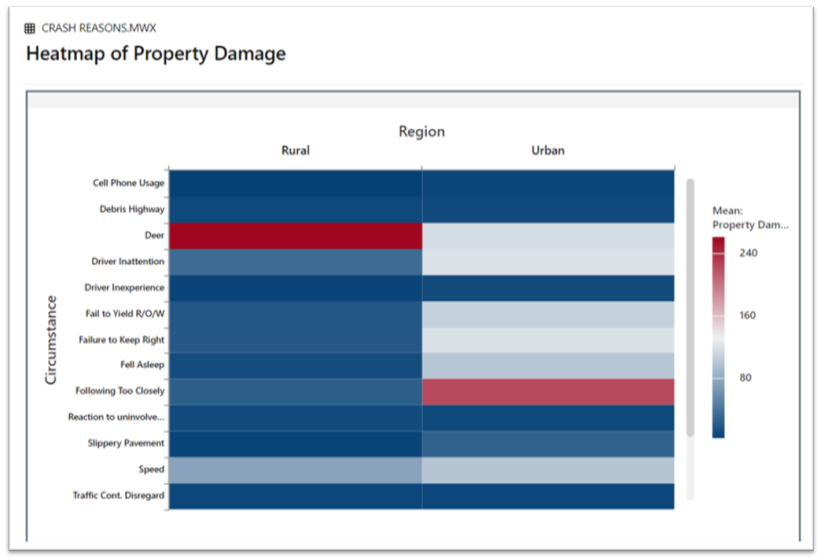
Heat Map
The new heat map in Minitab 20 allows you to visualize the effects of several categorical variables on a measured value. The various categorical variables are displayed in a table with a gradient that represents a function of the measured value, such as percentage of defects or average customer rating. Particularly interesting areas can thus be highlighted and scenarios that lead to particularly high or low values can be identified.
Compatibility of project files
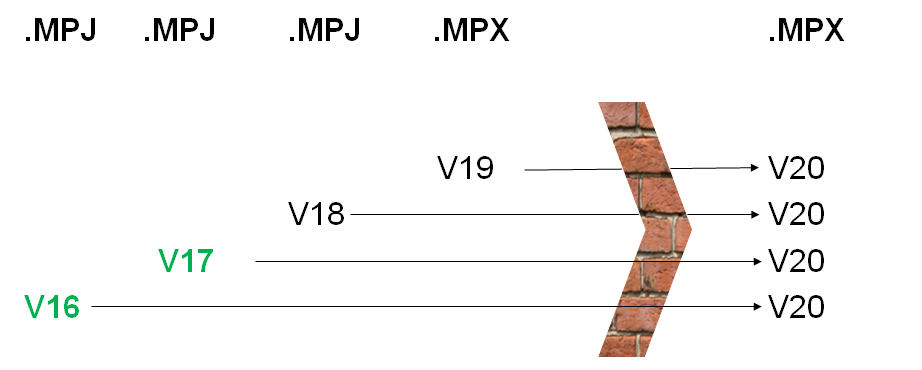
Hint:
During the upgrade the graphic objects loose their connection to the data, also the ReportPad of versions 16-18 is not converted to the files of version 20. ADDITIVE offers support and consulting on transferring older Minitab projects. Please contact your account manager.