![]()
What’s New in Minitab 16
Minitab 16 offers several new features and enhancements, including the new Assistant menu, all available within the same user-friendly interface. This document provides an overview of these new features and enhancements. In addition, it outlines interface changes you may find useful when updating your materials from Minitab 15 to 16
Minitab 16.2
Minitab 16.2 adds four new control charts to those already available in the software. Laney P' and U' control charts are similar to traditional P and U charts, but give you a more reliable indication of whether the process is truly in or out of control and eliminate false alarms. G and T charts help healthcare facilities and other businesses assess the time or opportunities between rare events. The Chart Diagnostic Tool will help you to make the best decission between P and P' control charts and U and U' control charts.
- p' und u' control charts by Laney
- g and t charts
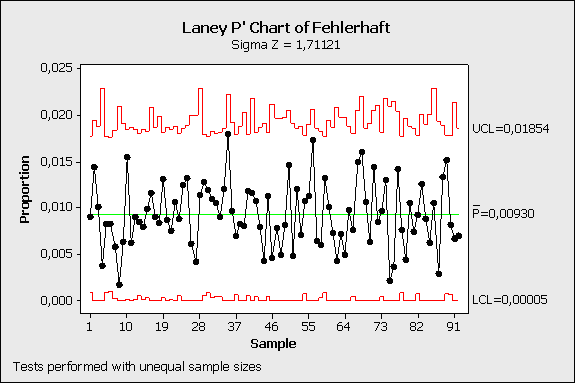
p'-Karte nach Laney (Click on the image to enlarge) |
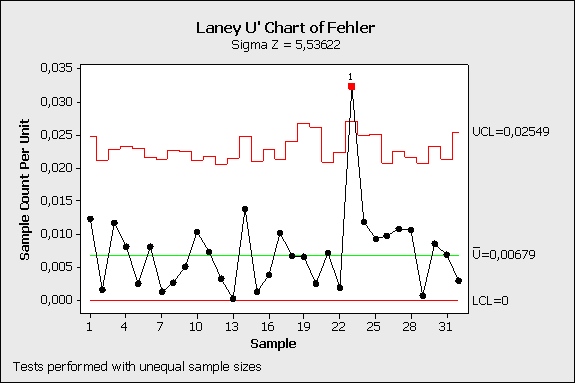
u' chart by Laney (Click on the image to enlarge) |
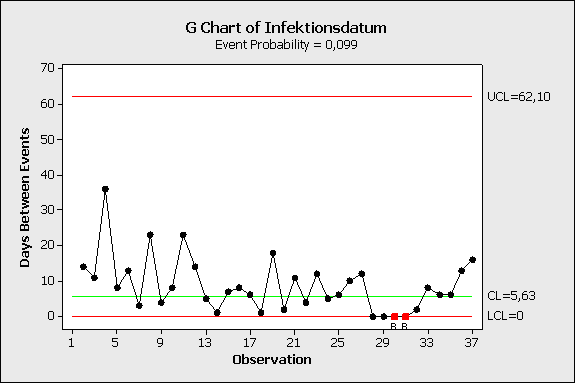
g chart (Click on the image to enlarge) |
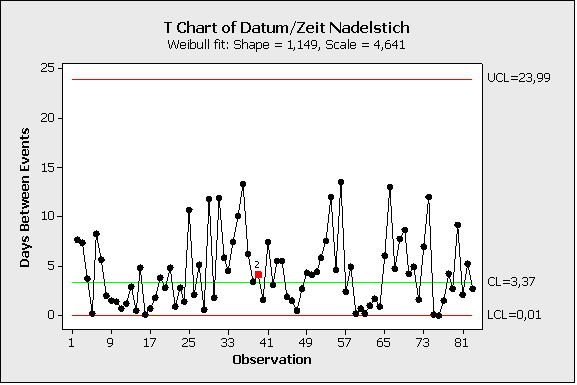
t chart (Click on the image to enlarge) |
The update is free for Minitab 16 users, via "Windows auto-update"; more in our Minitab supportarea
Read our exclusive interview with P' and U' chart creator David Laney
Minitab 16
Assistant
- Let Minitab’s Assistant menu lead you through your analysis.
- Follow an interactive decision tree to determine the right approach.
- Easily select the correct tool and review guidelines to ensure your analysis is successful.
- Save time conducting your analysis using a simplified interface.
- Use Minitab-generated interpretations to understand and respond to your results.
- Present your findings using detailed, comprehensive reports.
Basic Statistics
Display Descriptive Statistics
Choose to display all, none, or your default statistics.
1 Variance
Perform a hypothesis test for the variance or standard deviation.
2 Variances
- Perform a hypothesis test for variances or standard deviations.
- Specify a one- or two-sided alternative hypothesis.
- Specify a hypothesized ratio.
- Compare samples using built-in graphs.
Regression
General Regression
- Easily specify interaction and polynomial terms.
- Include both continuous and categorical predictor variables.
- Calculate confidence intervals for regression coefficients.
- Transform the response variable using the Box-Cox transformation.
Nonlinear Regression
Fit a nonlinear model using a catalog of expectation functions, or specify your own function.
Orthogonal Regression
Fit a model for a predictor variable that has error.
Binary Logistic Regression
- Calculate confidence intervals for event probabilities.
- Store event probabilities in the worksheet for all or unique observations.
Ordinal and Nominal Logistic Regression
Event probabilities stored in the worksheet for all observations.
Partial Least Squares
- Easily specify interaction and polynomial terms.
- Include both continuous and categorical predictor variables.
Analysis of Variance
One-Way ANOVA
Evaluate comparisons using a grouping information table.
General Linear Model
- Calculate predicted values for new observations.
- Evaluate comparisons using a grouping information table.
Design of Experiment
Split-Plot Designs
Create and analyze designs with hard-to-change factors.
Additional Enhancements
- Easily view longer factor names in the Terms dialog.
- Display sum of squares for individual terms.
- Randomize a design and sort by run order in one step.
Control Charts
Attributes Charts
Create P' and U' charts to monitor defectives and defects with large subgroup sizes.
Rare Event Charts
Monitor rare events with G and T charts.
Nelson Estimate Method
Create Individuals and I-MR charts using the Nelson estimate for standard deviation.
Quality Tools
Pareto Chart
Create Pareto charts using a more flexible interface.
Capability Analysis
- Access the Box-Cox and Johnson transformations in one location.
- PPM included on the Sixpack™.
- Option to display Benchmark Z’s (sigma level) on the Sixpack™.
Tolerance Intervals
Calculate tolerance intervals for normal and nonnormal distributions.
Gage Run Chart
Create a run chart with missing data (unbalanced studies).
Crossed and Nested Gage R&R
Calculate confidence intervals.
Expanded Gage R&R
- Analyze studies with missing data (unbalanced studies).
- Analyze studies that have more than two factors.
- Include terms that are crossed or nested.
- Include factors that are fixed or random.
Create Attribute Agreement Analysis Worksheet
Create a data collection worksheet for Attribute Agreement Analysis.
Attribute Agreement Analysis
Display a disagreement summary table when known standard values are provided.
Multivariate
Principal Components Analysis
- Display Mahalanobis distances using an outlier plot.
- Store Mahalanobis distances in the worksheet.
Power and Sample Size
1 and 2 Proportions
Use simplified fields to specify input values.
Plackett-Burman Design
Specify the number of corner points using a dropdown field.
New Power and Sample Size Tools
- Sample Size for Estimation
- Paired t
- 1- and 2-Sample Poisson Rates
- 1 and 2 Variances
- General Full Factorial Design
Help
New Tutorials
Learn how to use Minitab’s most popular tools with 45 new tutorials.
Meet Minitab
Easily access this guide to getting started from the Help menu.
Sample Data Sets
New sample data sets available, including those used in StatGuide.
Additional Features
Languages
Access Minitab in seven languages.
Improved Performance
- Quickly import datasets.
- Open larger project files even faster.
- Run your analysis even faster.
Export to PowerPoint and Word
Export output directly to Microsoft PowerPoint or Word.
Line Plot
Choose to display Y as a percent.
Tally Individual Variables
Store results in the worksheet.
DMAIC Toolbar
Use Manage Profiles to easily access the popular toolbar that organizes statistical tools according to the DMAIC roadmap.