New in Minitab 19 Flyer
Download FlyerWhat's New in Minitab 19
Versionen 19.1 & 19.2 & 19.2020.1
Simplified User Interface • Powerful Features • Faster Performance
The simplified user interface and the new powerful features in Minitab 19 allow users to analyze large datasets using 64 bit.
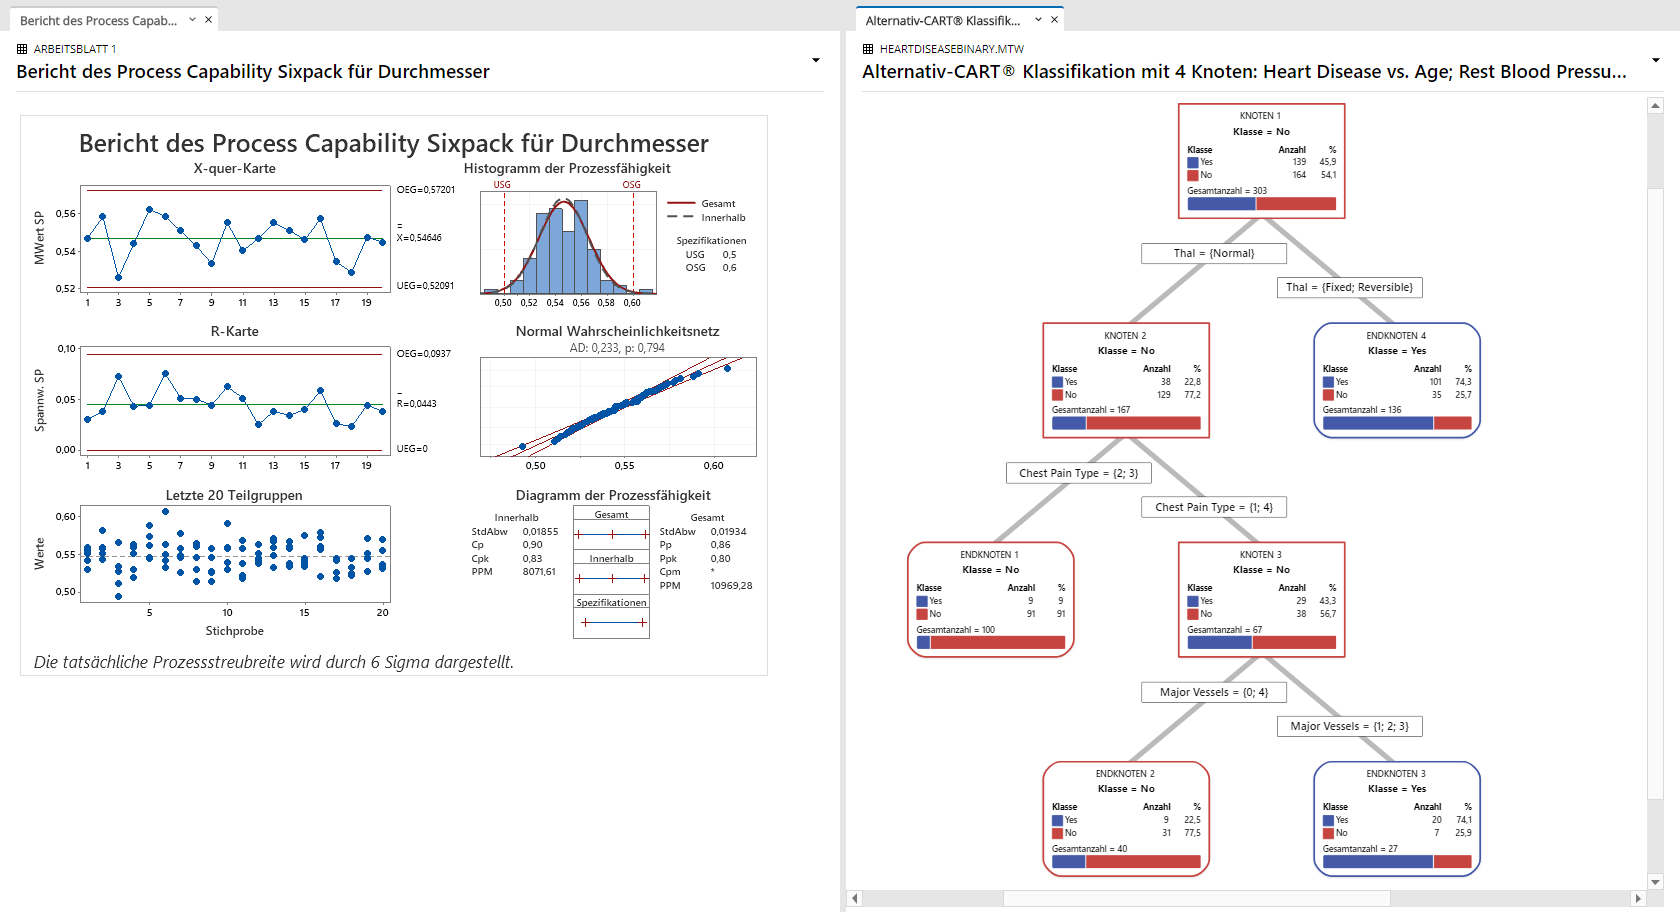
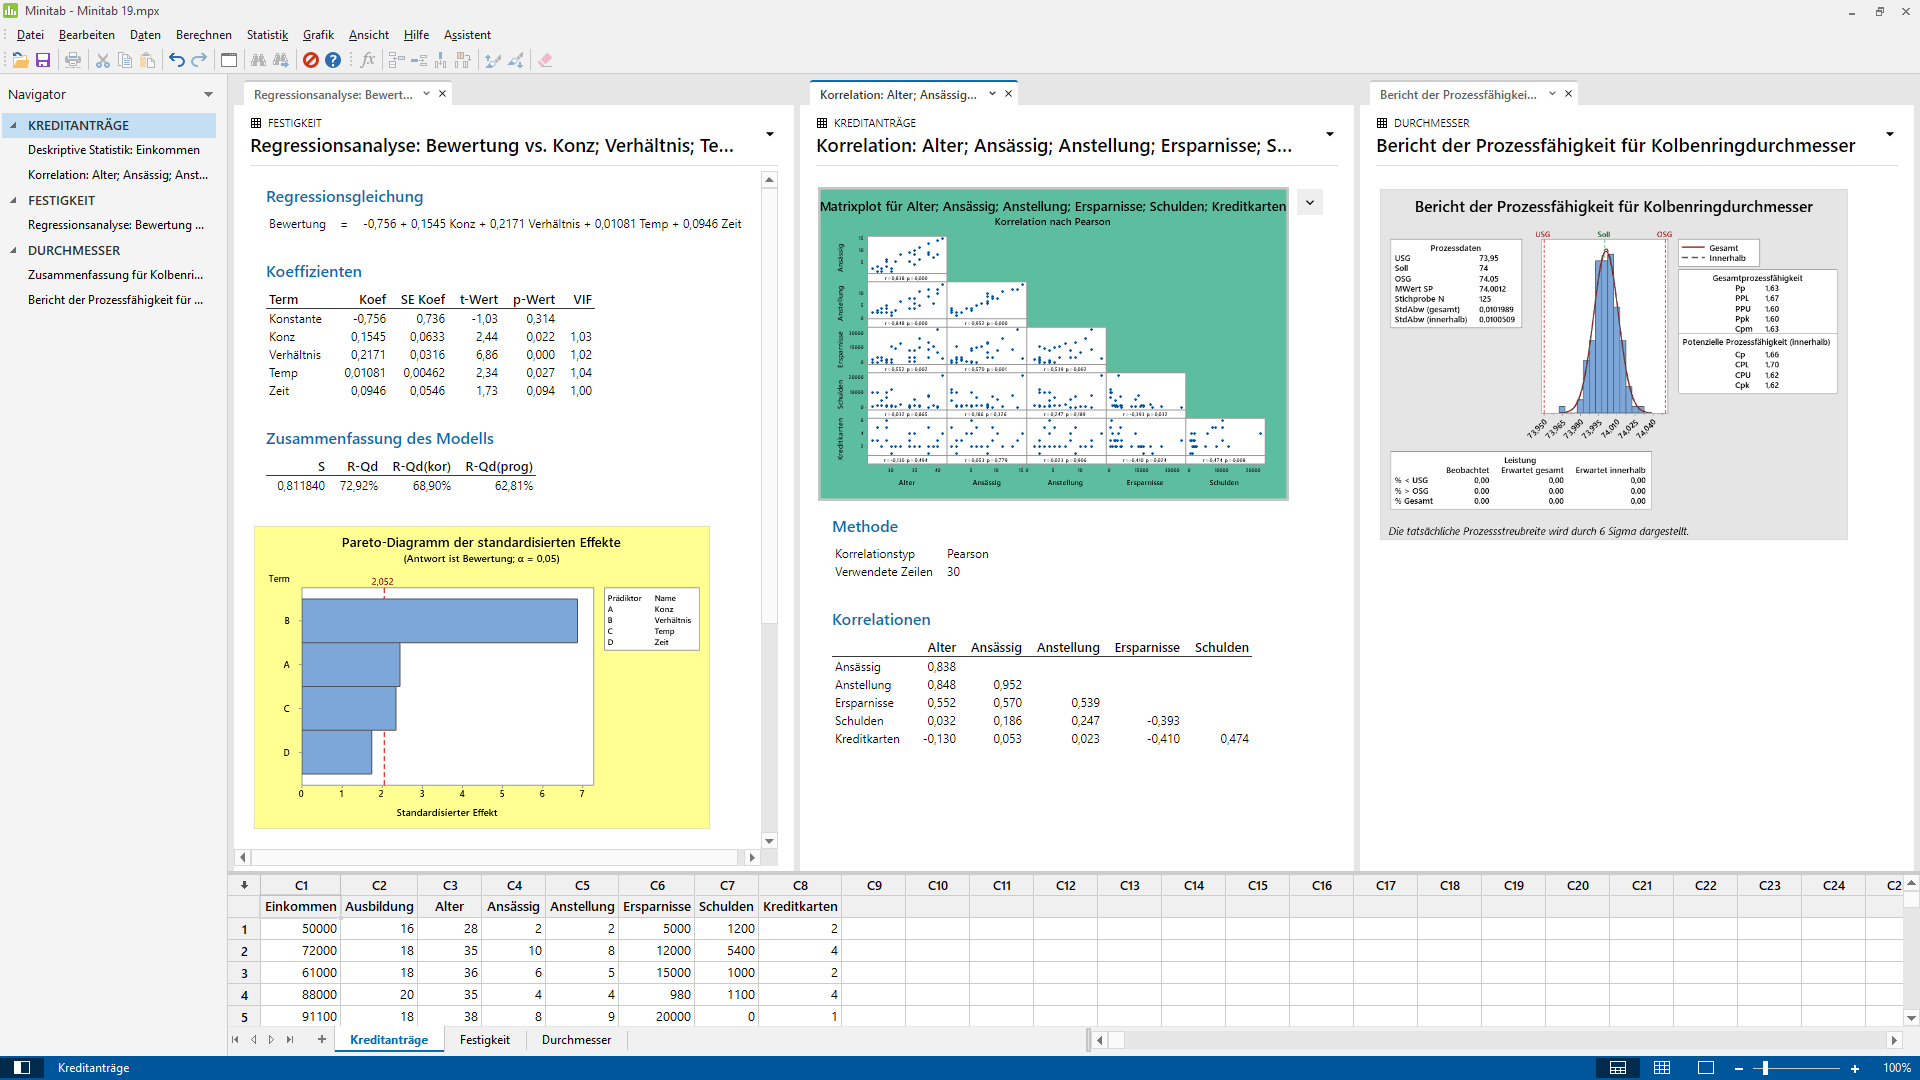
By means of the new navigator feature in Minitab 19, users can group results and analyses by worksheet, sort them alphabetically or run them by a specific order. Moreover, the new split view of the analysis results enables users to compare multiple analyses directly.
New statistical features for DoE (Design of Experiments), stepwise regression and normal capability facilitate more complex data analyses significantly.
Due to the new 64-bit version and enhanced algorithms, Minitab 19 outputs results faster and analyzes larger datasets than ever before.
Simplified workspace, structured logically
- New navigator
- New output window including events and visualizations
- Fast switching between worksheets by tabs
More commands for updating results automatically
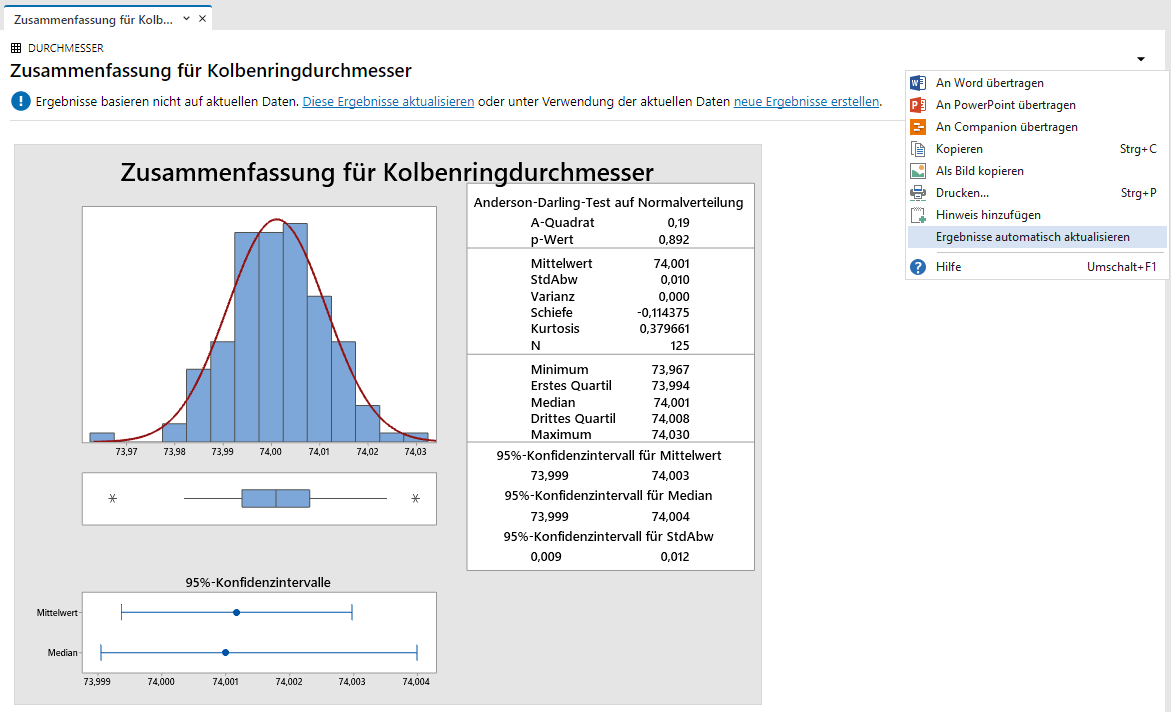
- In addition to graphical outputs and control charts, graphical summary, Pareto charts, capability analysis and normal probability plot can be updated automatically now.
Improved modelling – model selection criteria
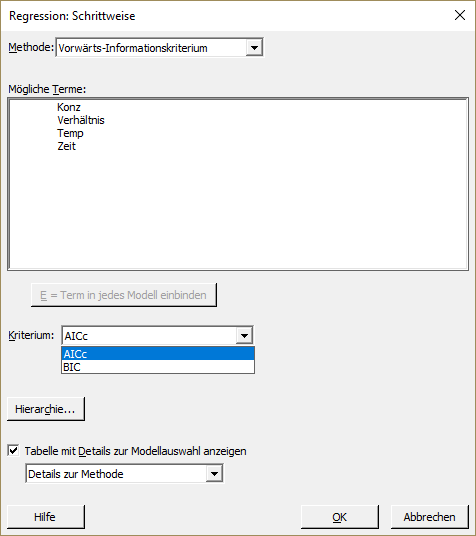
- New method "forward information criterion"
- Stepwise model selection for regression, variance analysis (ANOVA) and DoE (Design of Experiments)
- AICc (Akaike information criterion) & BIC (Bayesian information criterion)
Binary response variables for DoE
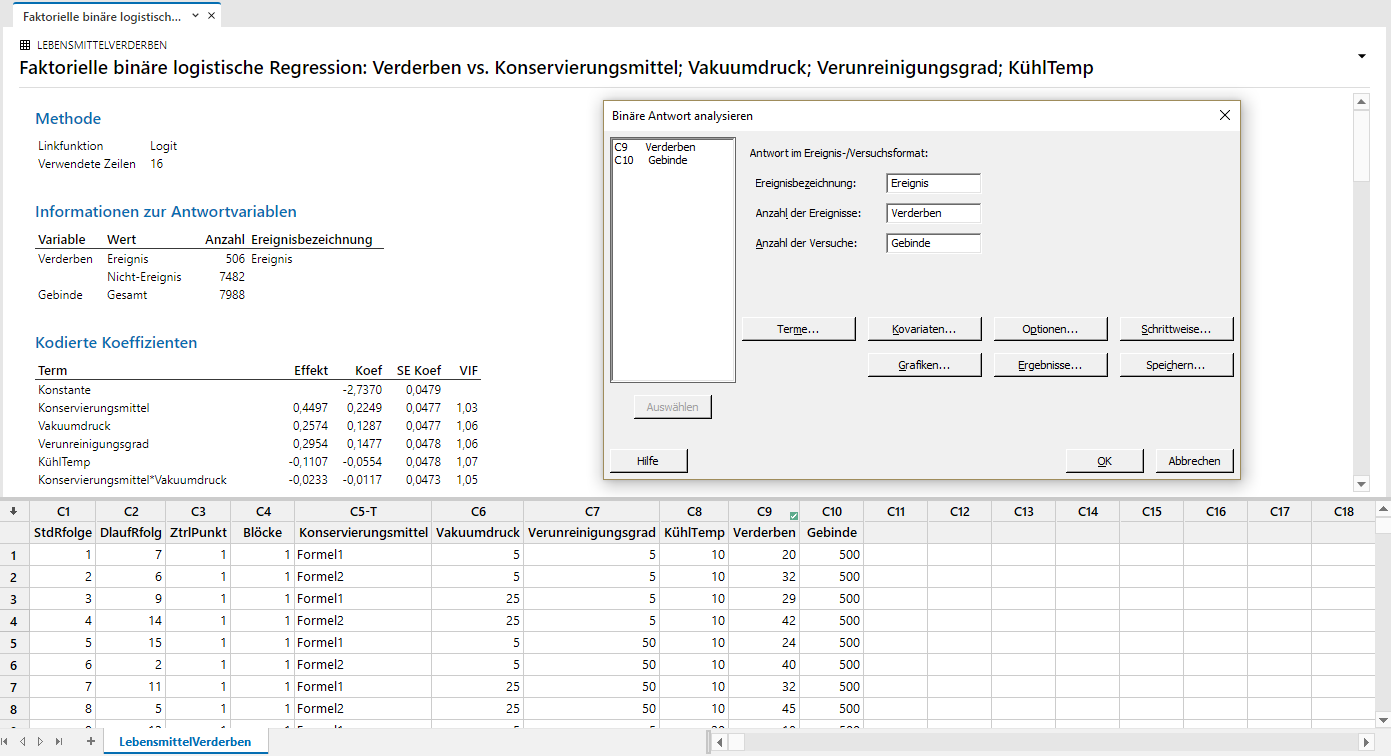
- Analyze data from binary response variables (e.g. good/bad) by using a design
- can be used with factorial, screening and response surface designs
- response optimization can contain continuous and binary response variables
Improved process capability (normal)
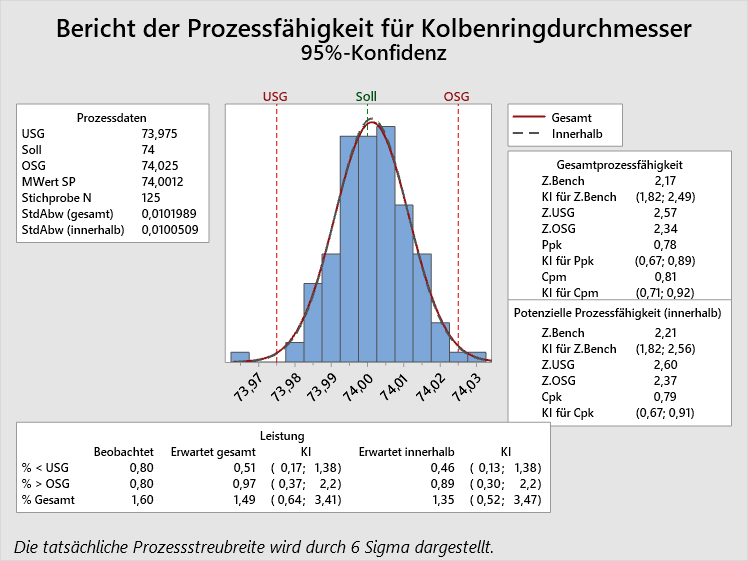
- Confidence intervals for further parameters
- Optimized method for calculation of lower limit for Z.Bench
- New global option for showing PPM or % and KIs
Resampling/Bootstrapping/Randomization Test
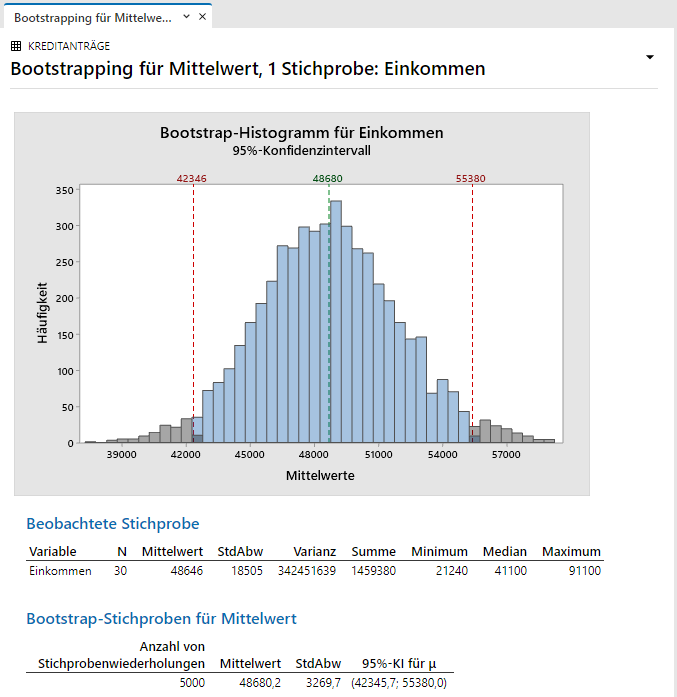
- Calculate confidence intervals
- Perform hypothesis tests for statistics without assuming a distribution
Better Predictions
(Minitab 19.2020.1)
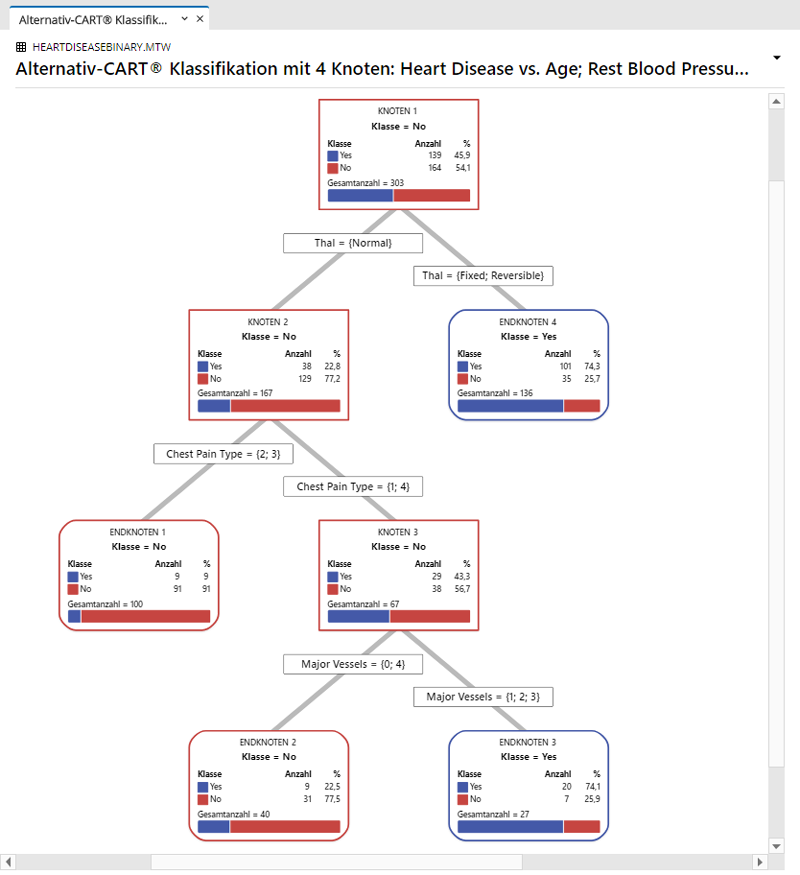
Unlock a better, more robust analytics toolkit that will expand your decision-making capabilities, proactively improve your process to achieve better results and avoid costly mistakes with the addition of our predictive analytics tool: Classification and Regression Trees (CART®). As one of the most popular and useful prediction tools, CART® is now available in a fast and ease-to-use format within Minitab so you don't need to be a data scientist to use it.
Faster Model Building with Validation
(Minitab 19.2020.1)
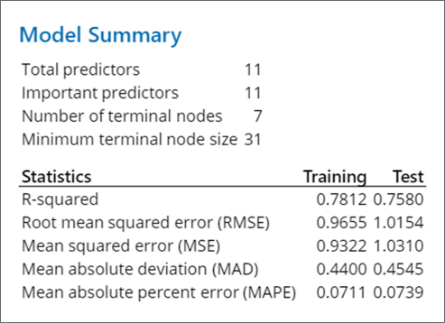
Assess accuracy of your Regression models fast with validation. Effortlessly resample or partition your data into test and training sets with speed, then evaluate your model prediction accuracy faster than ever. Includes Regression and Binary Logistic Regression.
Easier Integration
(Minitab 19.2020.1)
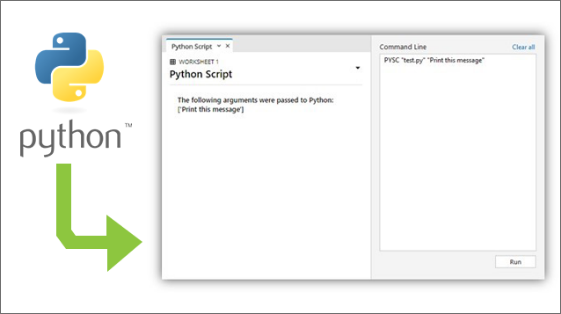
Unite Python scripts with your Minitab data and analysis easily within Minitab Statistical Software thanks to open source integration. Capitalize on the ability to expand and further explore your analytical possibilities in the interface or with a macro. Collaborate with data scientists to solve even more problems, easier with Minitab.
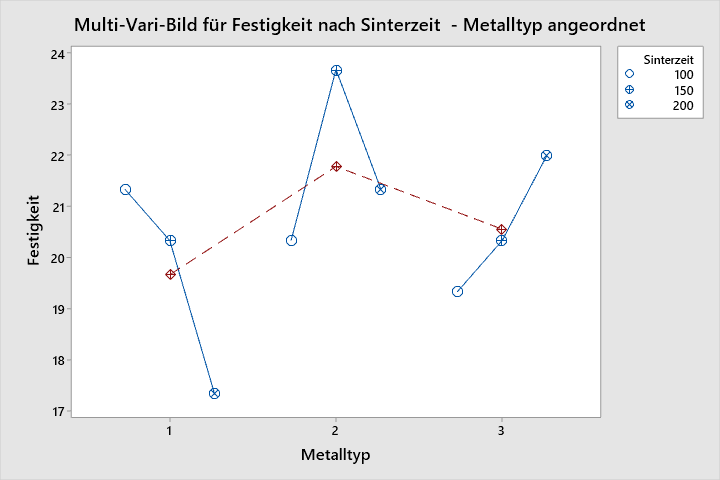
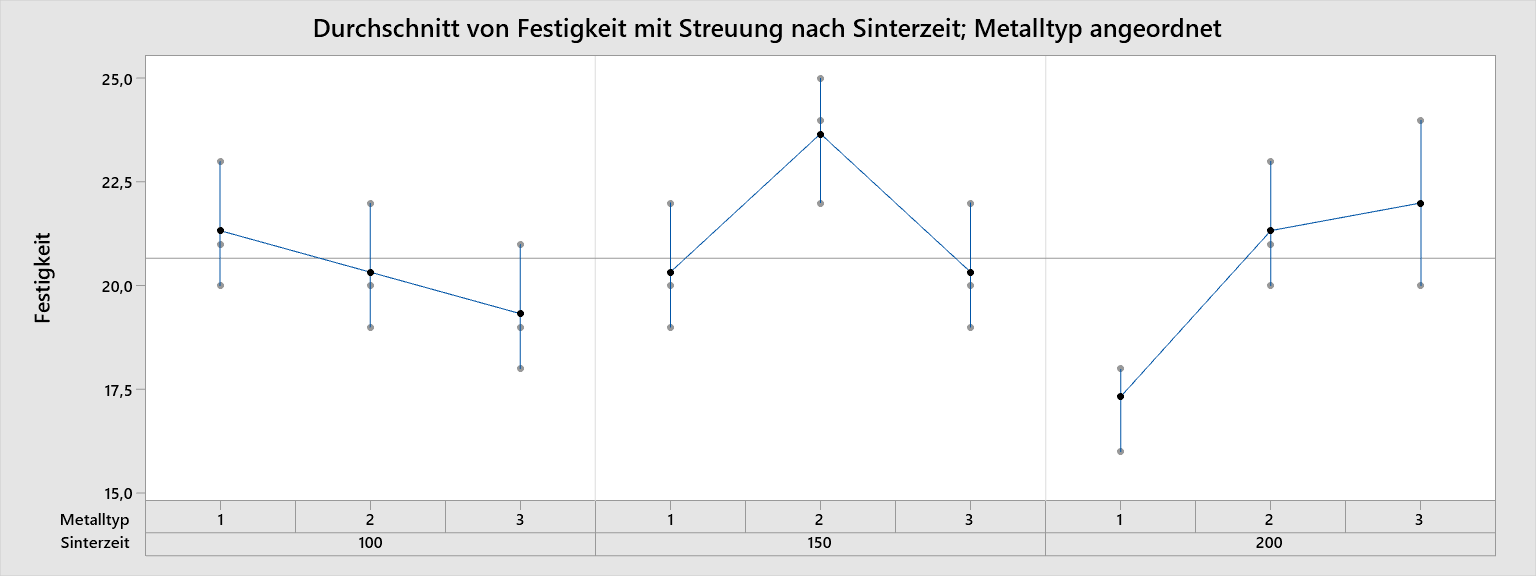
Enhancing Multi-Vari chart under Quality Tools
(Minitab 19.2)
It is a popular tool for Minitab users to visualize different sources of variations, particularly for evaluating measurement systems.
This chart to visualize variability can be used in any applications with a response variable and multiple factors as exploratory variables. This command allows users to produce a nice Multi-Var Chart up to 8 factors. Gageaiag and Gagegeneral sample data sets can be help you to familiarize yourself with this command.
The new Multi-Vari chart will be easier to interpret.
Stability Study improvement
(Minitab 19.2)
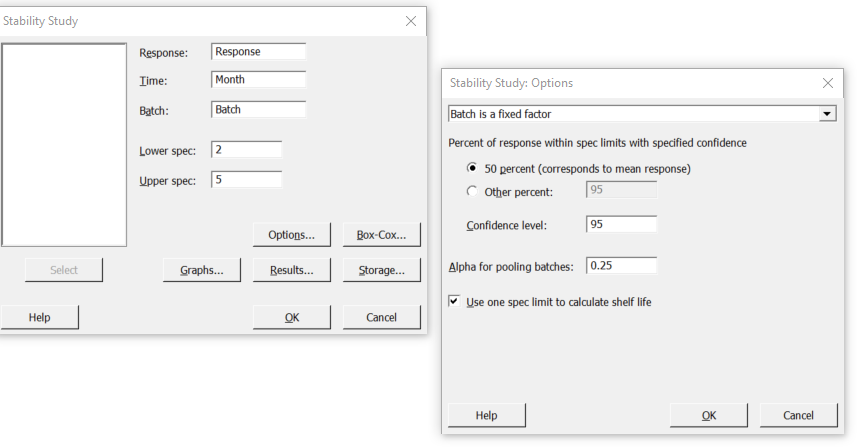
When two specification limits are entered in Stability Study Command, users will now have the option to calculate the shelf-life of a drug with one spec limit and to utilize the other spec limit for displaying only.
This new feature should be used frequently by pharmaceutical organizations. In the pharmaceutical industry, even if people have two spec limits, for many drugs, they have knowledge about whether the response values are increasing or decreasing overtime.
With this additional information, only one spec limit should be used to calculate the shelf-life.
Therefore, it is helpful to provide a checkbox in the Options sub-dialog for user to select employing one spec limit to calculate the shelf-life for this two-specification limits scenario.
Sample size added to the Correlation table
(Minitab 19.2)
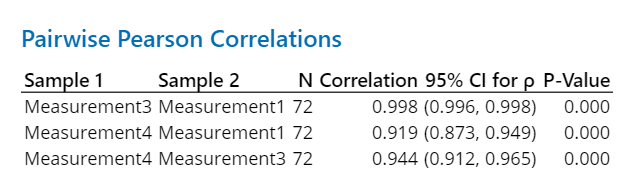
This design update to the correlation command will provide a better experience for users to easily interpret the results of their correlation analysis.
The enhancements include:
- Providing confidence intervals for Pearson and Spearman correlations
- Adding a matrix plot with the option to display correlation statistics such as point estimates, p-values for tests of zero-correlation, and confidence intervals for correlation.
- Providing a better table to display the analysis results with the ability to adjust the number of decimal places.
Pareto chart non-defaulted in Regression update
(Minitab 19.2)
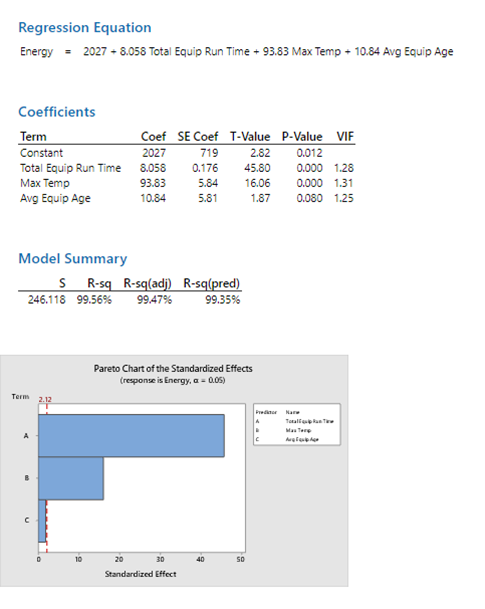
To help users clearly visualize your results, Regression now includes an optional Pareto to show significant effects.
Other useful features
- Improved editing of graphs and marking
- Improved assistant for hypothesis tests
- Matrix plot for correlations
- Regression: Pareto charts of effects
Performance improvements & other new features
- 64-bit version available for Windows
- Open Excel files considerably faster, return results twice as fast and plot graphs five times faster
- New file format with new file extensions
- Minitab for MacOS (slightly limited functionality)