The latest Minitab release is packed with new and improved statistical features
and other enhancements that give you greater insight into your processes.
| Assistant |
- Improvements made throughout the interface and output
- Report Cards and Diagnostic Reports for Graphical Analysis
- Multiple regression plus response optimization
- DOE for screening and modeling designs
- New menus for Before/After Control Charts and Capability Analysis
|
- Control Charts and Capability Analysis for equal or unequal subgroup
sizes
- Control Charts and Capability Analysis include check for Laney
P’ and U’ charts
- 2-sample Hypothesis Tests for stacked or unstacked data
- Number of levels increased for Chi-Square Goodness-of-Fit Test
|
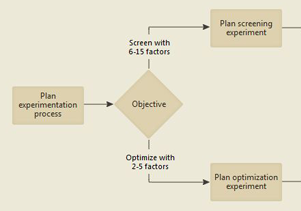
Assistant DoE |
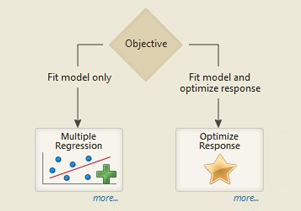
Assistent Regression |
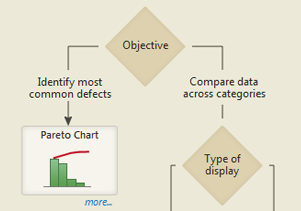
Graphical Analysis |
|
| |
|
| Basic Statistics |
Hypothesis tests
- Dialogs updated for consistency and clarity
- Session output includes Greek symbols
|
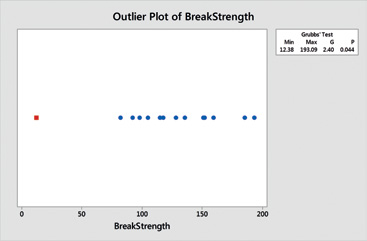
Outlier Plot |
2 Variances
- Graph provided to visualize results
- Bonett’s test for continuous distributions
|
Correlation
- Spearman’s rank correlation coefficient
|
Outlier tests
- Grubbs’ and Dixon’s tests for detecting outliers
|
| |
|
| Regression |
Fit Regression Model
- Easier interface for specifying model terms
- Easier interface for calculating predicted values
- Automatic model selection added to main dialog
- New graphs include main effects, interaction, contour and
surface plots
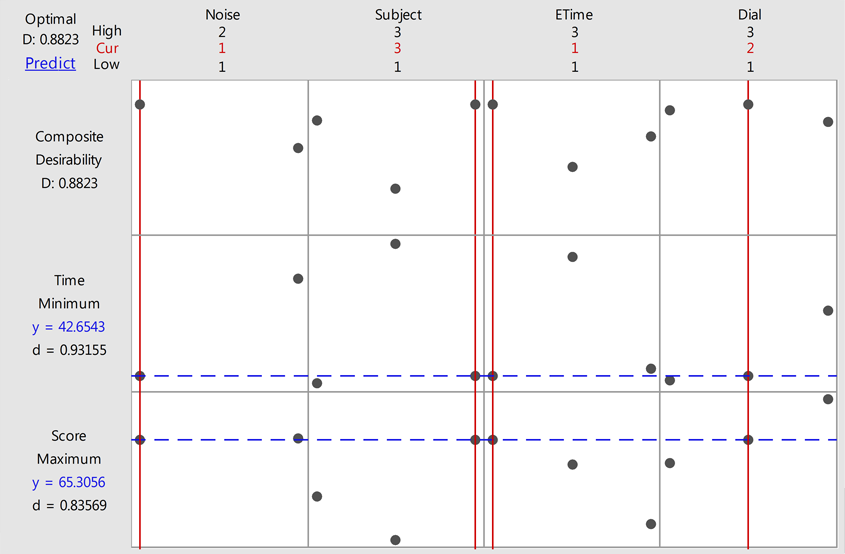
- Response optimizer to find optimal settings
|
Fit Binary Logistic Model
- Fitted Line Plot for graphing event probabilities
- Easier interface for specifying model terms
- Easier interface for calculating predicted values
- Automatic model selection to identify important variables
- New graphs include main effects, interaction, contour, and
surface plots
- Response optimizer to find optimal settings
|
Stability Studies
- Worksheet generator to define data collection plan
- Analysis for product stability and shelf-life
|
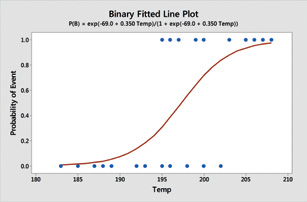
Binary Fitted Line Plot |
Poisson Regression
- Regression for Y variables that describe counts
|
| |
|
| Analysis of Variance |
General Nonlinear Model
- Easier interface for specifying model terms
- Easier interface for calculating predicted values
- Automatic model selection to identify important variables
- New graphs include contour and surface plots
- Box-Cox transformation
- Response optimizer to find optimal settings
- Results option to display full set of coefficients for all
factor levels
- Fisher’s method and graphical output for multiple comparisons
One-way ANOVA
- Single dialog for stacked or unstacked data
- Welch’s method for unequal variances
- Graph provided for multiple comparisons
Test for equal variances
- Multiple comparisons method
- Dialog updated to accommodate stacked or unstacked data
|
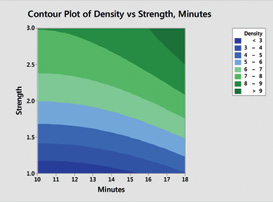
Contour Plot |
| |
|
| Design of Experiments (DoE) |
Factorial Designs
- Easier interface for specifying model terms
- Easier interface for calculating predicted values
- Non-hierarchical models
- Automatic model selection to identify important variables
- Box-Cox transformation
- Response optimizer for General Factorial Designs
- Response optimizer option for constraints
|
Applied response optimizer to general factorial designs |
Response Surface Designs
- Easier interface for specifying model terms
- Easier interface for calculating predicted values
- Categorical variables option
- Non-hierarchical models
- Automatic model selection to identify important variables
- Box-Cox transformation
- Response optimizer option for constraints
|
| |
|
| Control Charts |
All Control Charts
- Sigma limits drawn in addition to control limits
|
T Charts
- Exponential distribution option
|
| |
|
| Quality Tools |
Tolerance Intervals
- Option to store tolerance factors
- Graph includes achieved confidence for nonparametric method
- Power and sample size analysis
|
|
| |
|
| Tables |
Cross Tabulation and Chi-Square
- Dialog updated to improve ease of use
- McNemar’s Test for paired proportions
|
Chi-Square Test for Association
- Dialog updated to accommodate raw or summarized data
- Labels option for data in summarized format
|
| |
|
| Equivalence Tests |
- Tests for 1-sample, 2-sample, paired and 2x2 crossover designs
|
- Power and sample size analysis
|
| |
|
| Graphs |
Bubble Plots
- Graph for plotting three or four variables in a two-dimensional
space
|
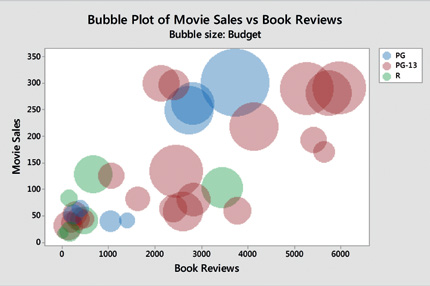
Bubble Plot |
Updated Graphics
- Modernized color palette, font, and more
|
View Model
- Regression, GLM, and DOE graphs provide associated model
equation
|
| |
|
| Additional Features |
Round Date/Time
- Round date/time columns to the nearest year, quarter, month,
etc.
|
Manage Profiles
- DMAIC profile with latest functionality
- DMAIC profile using the Assistant
|
Default Estimation Methods
- New default estimation methods for control charts, capability
analysis, and reliability/survival
|
Worksheets
- Visual indicator for missing text values
- View model equation for regression, GLM, and DOE response
columns
|
Toolbars
- New and improved toolbars for the Assistant, regression,
GLM, and DOE
|
Portuguese Version
- Minitab available in English, Spanish, French, German, Japanese,
Korean, Simplified Chinese, and now Portuguese
|