New in Minitab 21.4.1, 21.4, 21.3, 21.2 & 21.1
What's New in Minitab 21 Flyer
Download FlyerShort Overview of new features in Minitab 21.4.1
Minitab 21.4.1 provides important bug fixes and two optional add-on modules for professionals who want guided analyses for research and development departments or reliability analysis. Like all add-on modules, these are only available as name-user licences.
- New optional modules:
- Reliability
- Research and Development
New optional modules

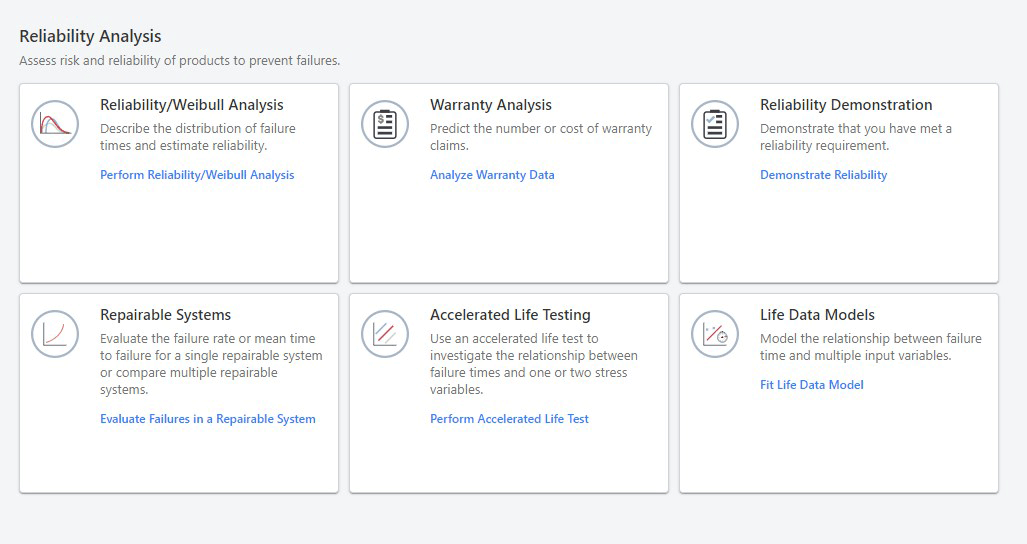
Module "Reliability"
Minitab’s Reliability Module places the most robust calculations conveniently within reach, enabling accurate insights and informed choices.
The Reliability Module equips engineers with the tools they need to perform warranty analysis, use life data models, and conduct reliability/Weibull analysis. With these features, you can identify and eliminate issues with your products, ensuring they function smoothly and reliably for your customers.
Module "Research and Development"
With its intuitive interface and comprehensive set of tools, Minitab's Research and Development Module empowers professionals in the R&D field to delve into complex data analysis with the best tools right at their fingertips.
The Research and Development Module empowers researchers and engineers to rapidly begin designing experiments, estimating reliability and survival, describing data and understanding relationships among variables.
Short Overview of new features in Minitab 21.4
Minitab 21.4 includes the proprietary MARS® Regression feature which expands upon Minitab’s predictive analytics capabilities to create accurate predictive models for a continuous response with many continuous and categorical predictor variables. Minitab 21.4 also includes graph editing enhancements and the ability to update or create new results for some statistical features when data change.
- Predictive Analytics Module: New Feature: Multivariate Adaptive Regression Splines (MARS)
- Highcharts Graph Editing
Predictive Analytics Module: New Feature Multivariate Adaptive Regression Splines (MARS)
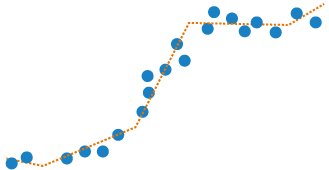
MARS® is an important alternative analytical technique when conventional regression methods fail to work.
MARS® is the latest advanced predictive analytics solution that uncovers important data patterns and relationships that are difficult, if not impossible, for other regression methods to reveal. The MARS modeling engine builds its model by piecing together a series of straight lines, with each allowed its own slope. This permits the MARS modeling e
Highcharts Graph Editing
The graph editing feature update allows users to customize their results.
- Add Regression Fit for Scatterplot & Matrix Plot
This feature provides the option to add a regression fit to an already-created scatterplot or matrix plot via the editing pane and specify the type as well as whether to include the y-intercept. - Add Percentile Line for Probability Plot
This feature provides the option to add percentile lines at specified values along the X or Y scale to an already-created probability plot.
Note: this option will apply to the selected graph only. - Adjust Probability Plot Y-Scale
This feature will provide the option to change the Y-scale type between percent, probability, and score on an already-created probability plot.
Note: this option will apply to the selected graph only.
- Adjust Histogram Binning
This feature provides the option to change the interval type on the X-scale (binning) between midpoint and cutpoint as well as the interval definition for binning by specifying the number of intervals or choosing custom midpoint/cutpoint positions on a histogram.
Note: this option will apply to the selected graph only.
Short Overview of new features in Minitab 21.3
- Interval Plot in Graph Builder
- Matrix Plot in Graph Builder
- Distribution fit added to existing Graph Builder Histogram
- New optional chargeable modules:
- Measurement System Analysis
- Sample Size
- Insurance KPIs
Graph Builder
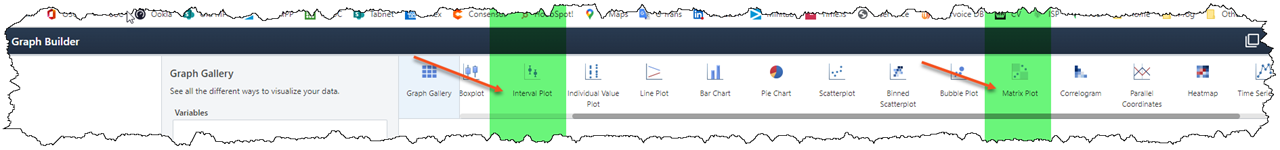
In Minitab 21.3, both the interval and the matrix plot have been added to the Graph Builder.
The interval plot is used to assess and compare confidence intervals of the means of groups. It is particularly suitable when the sample size is at least 10 per group. The matrix plot is an array of scatter plots and allows relationships between multiple pairs of variables to be examined simultaneously.
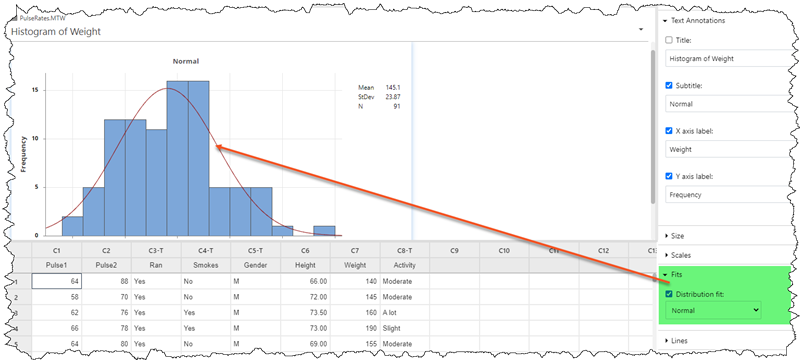
A distribution fit was added to the histogram in Graph Builder. The new histogram fit is to add a model fit after the creation of a histogram in the Graph Builder.
New optional chargeable modules
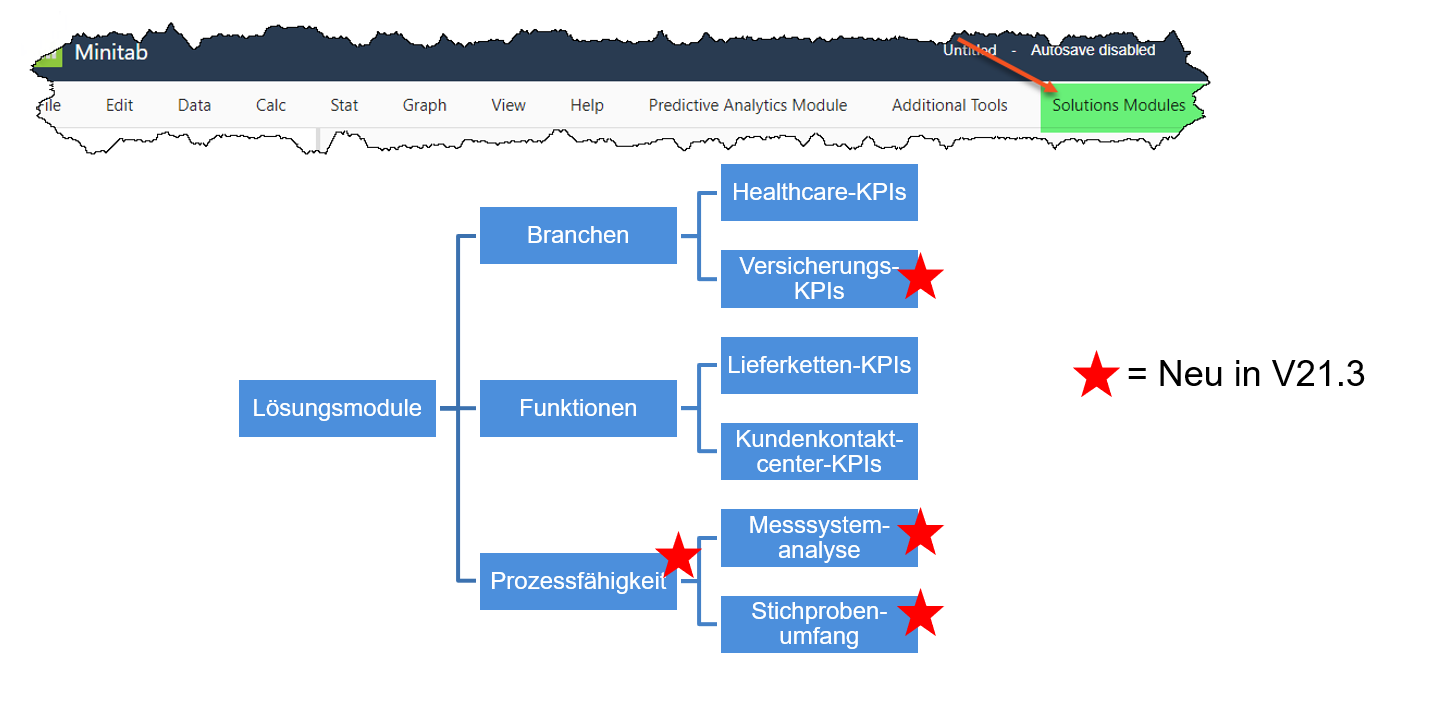
On the optional ‘Solutions Modules’ menu, the new optional chargeable modules "Measurement System Analysis", "Sample Size" and "Insurance KPIs" have been added.
Module Measurement System Analysis
Minitab's Measurement System Analysis module provides guided data analysis to solve the most common measurement system analysis challenges. This allows you to focus on solving the problem without having to waste time deciding which analysis to use.
Modul "Sample Size"
Minitab's Sample Size module provides guidance on estimating the required sample size to ensure that the discriminatory power is sufficient for your purposes.
Modul "Insurance KPIs"
Designed specifically for insurance professionals, Minitab's Insurance Industry module provides guided data analysis to solve common insurance industry challenges. Users can focus on calculating, analyzing, and improving key performance indicators (KPIs) without having to think long and hard about the appropriate analysis:
- Claim settlement duration
- Revenue per policyholder
- Loss ratios
Short Overview of new features in Minitab 21.2
Minitab Statistical Software 21.2 was released 29th and adds new features in the Time Series area of the Stat Menu and the Graph Builder tool.
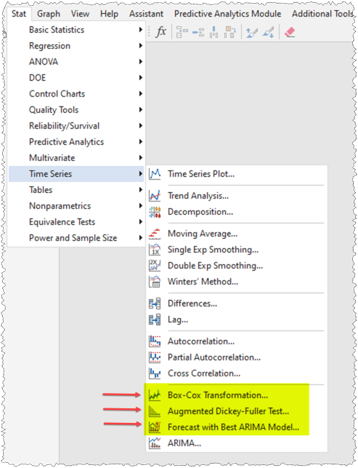
Stat Menu: Additions to "Time Series" area
- Forecast with Best ARIMA Model
- Augmented Dickey-Fuller Test
- Box-Cox Transformation
Graph Menu: Additions to Graph Builder tool
- Line Plot
- Stacked Area Graph
- Pie Chart
Short Overview of new features in Minitab 21.1
- New Statistical Method: Cox Regression
- Graph Builder Enhancement: Interactive Probability Plot
- Enhanced Visualisations: Additional Graph Editing
- Predictive Analytics Module enhancement: Automated Machine Learning
- Healthcare Module enhancement: Localisation for all languages (Spanish, French, German, Portuguese, Japanese, Korean, Simplified Chinese)
New Statistical Method: Cox Regression
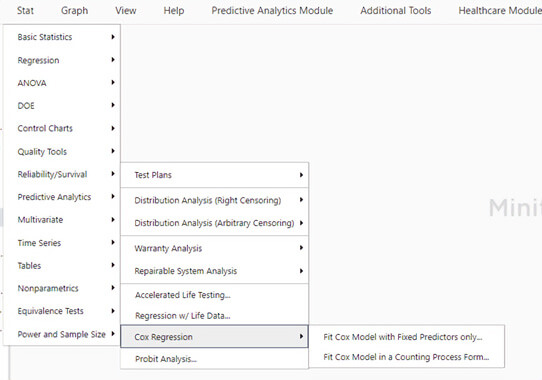
- Cox regression is a method for investigating the effect of several variables upon the time a specified event takes to happen.
- The Cox Regression command is in the Reliability menu.
- Cox Regression is also known as Proportional Hazards Regression.
Visualisations: Interactive Probability Plot added to the Graph Builder
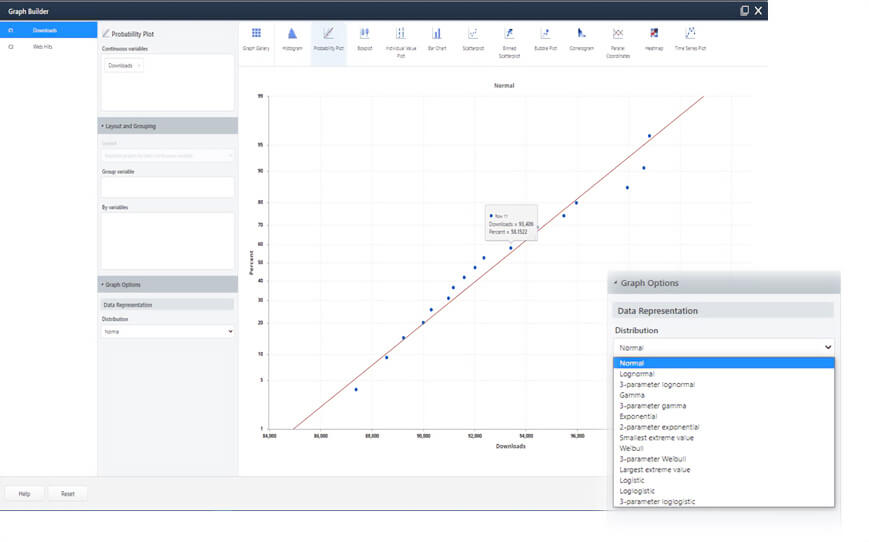
- An interactive probability plot is now available in the Graph Builder.
- Select fits from 14 distributions.
Enhanced Visualisations: Additional Graph Editing
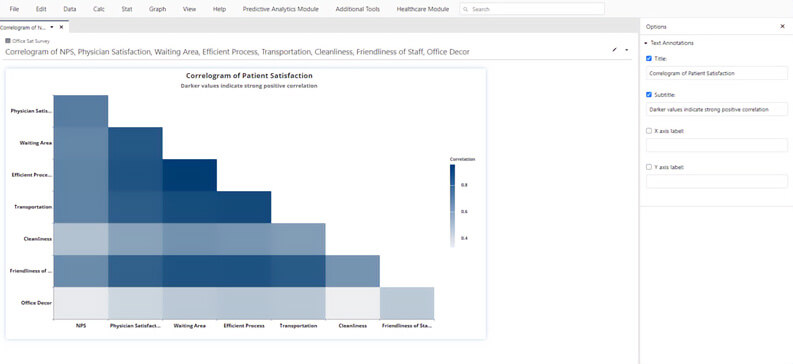
You can now add and customize text annotations like titles and axis labels, modify graph-specific scale and distribution types, and access certain display options like transposing axes for categorical graphs and other data representation options.
Predictive Analytics Module: Automated Machine Learning
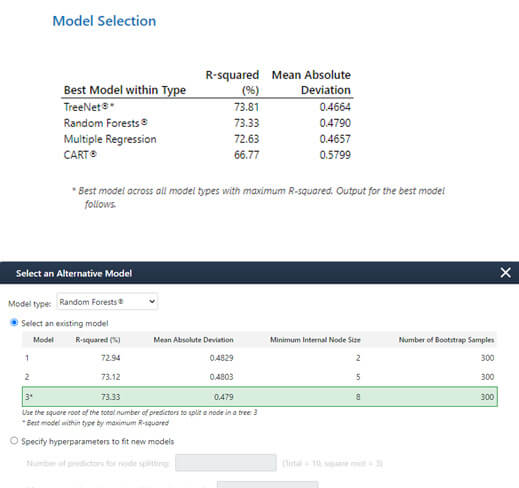
- It is common for researchers to try a few different machine learning models when evaluating their data. The new AutoML feature will evaluate the following models:
- Classification and Regression Trees
- TreeNet
- Random Forests
- Regression
- Minitab Statistical Software will pick the best model based on criteria and display the model fit.
- Users have the flexibility to easily select one of the other models.
This feature is only available in the Predictive Analytics Module.
Healthcare Module: Localisation
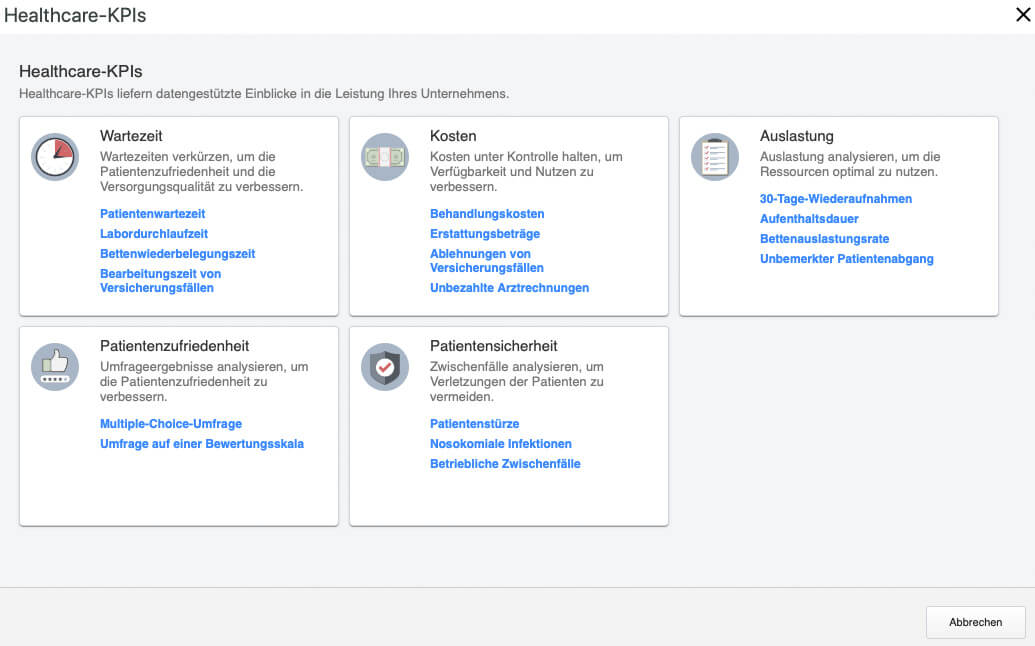
- The Healthcare module is now available in all Minitab supported languages.
- Localisation for all languages
- Spanish
- French
- German
- Portuguese
- Japanese
- Korean
- Simplified Chinese