New in Minitab 22.4, 22.3.1, 22.3, 22.2 & 22.1
Short Overview of new features in Minitab 22.4
Minitab 22.4 introduces several new features that expand analysis capabilities and enhance usability:
- Response Optimization in the Predictive Analytics Module
- Interactive Variability Chart in Graph Builder
- Enhanced Graph Builder Editing of Labels
- Support for the VDA 5 standard in type 1 measurement system analysis
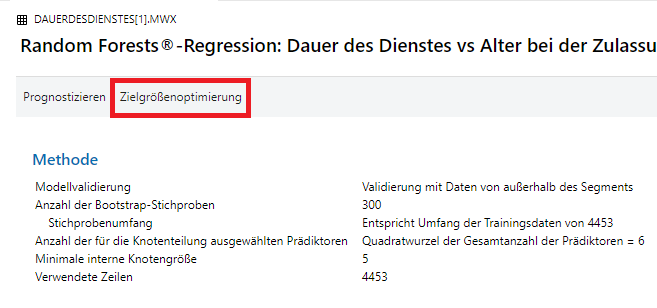
Response Optimization in the Predictive Analytics Module
Response optimization is a powerful new tool in the Predictive Analytics module of Minitab 22.4 that helps you achieve optimal results from predictive models by selectively adjusting predictor variables.
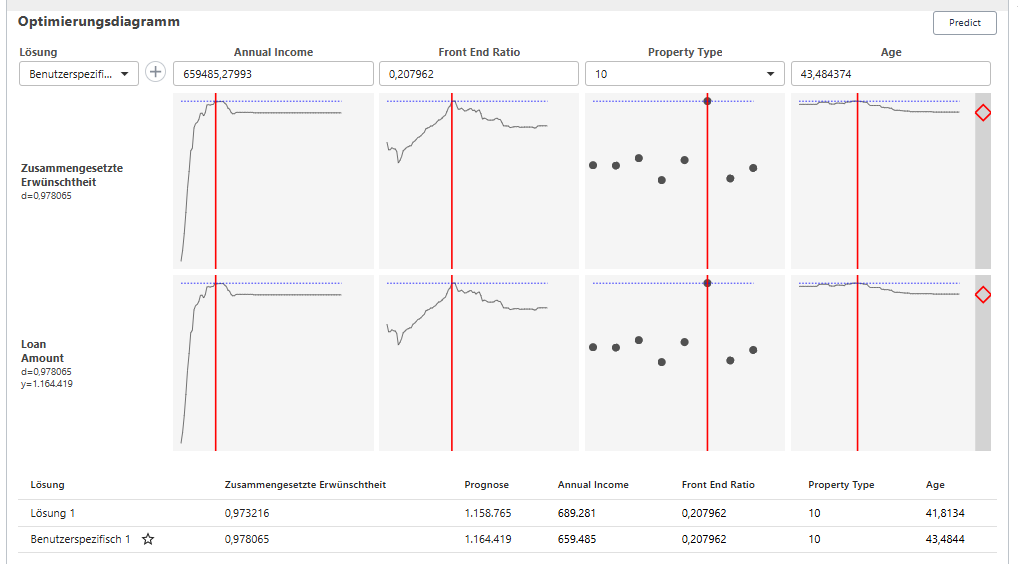
To do this, first create a predictive model for a single response variable using TreeNet®, Random Forests®, or MARS®, and then select the Response Optimization tool from the toolbar at the top of the model results. Alternatively, you can create a new interactive optimization plot in which you can interactively determine the optimal settings for predictor variables that lead to the desired result or response value. The optimization chart allows you to visually track how changes to the inputs affect the desired response.
Interactive Variability Chart in Graph Builder
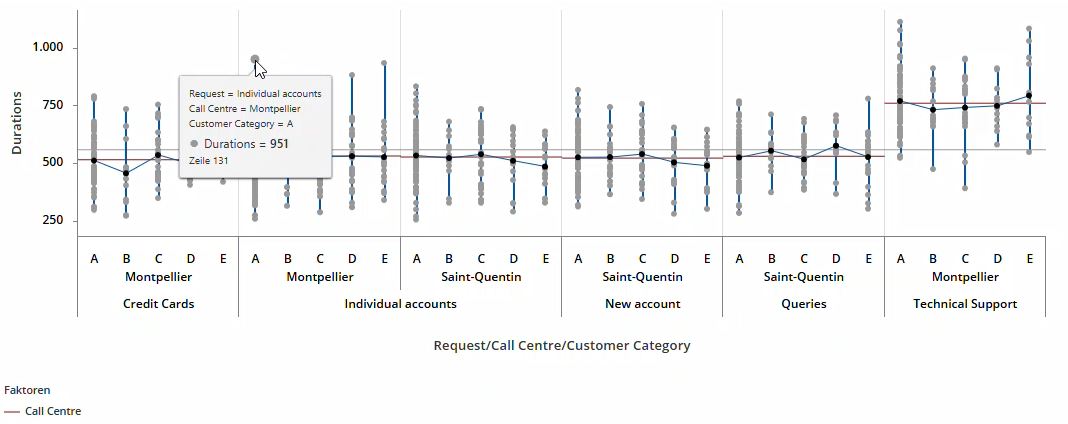
The Graph Builder in Minitab 22.4 has been enhanced with an interactive variability chart that allows you to visually identify sources of variation and more quickly understand relationships between factors and outcomes.
Enhanced Graph Builder Editing of Labels
Since Minitab 22.4, the Graph Builder has allowed you to customize the default display of the number of decimal places for numeric values on the x- and y-axes in graphs. The corresponding settings can be found in the context menu of the graph in the “Options” section.
Support for the VDA 5 standard in type 1 measurement system analysis
The Type 1 measurement system analysis in Minitab 22.4 supports the VDA 5 standard of the German Association of the Automotive Industry, which focuses on uncertainty-based approaches to measurement system analysis and contains guidelines for ensuring the performance and suitability of measurement systems in industrial manufacturing environments, particularly in the automotive sector.
Short Overview of new features in Minitab 22.3.1
Minitab 22.3.1 offers new variability chart options and two optional paid add-on modules (Transportation and Retail) for professionals who want to perform guided analysis in transportation or retail. Like all add-on modules, these are only available as named-user licenses.
- New optional modules:
- Transportation
- Retail
Variability Chart Enhancements
For the variability chart, Minitab 22.3.1 allows you to enter a category or multiple categories using the "By Variable" function to create a separate variability chart for each category for better comparison.
In addition, a logarithmic scale can be set for the variablity chart, which applies a log-10 transformation to the Y-scale of the plot. This is particularly useful for highly skewed factors or those influenced by severe outliers.
Variability Chart with untransfromed Y-scale
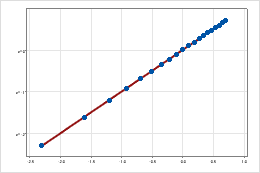
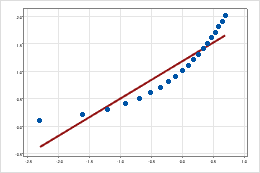
Variability Chart with transformed Y-scale on a log base 10 transformation
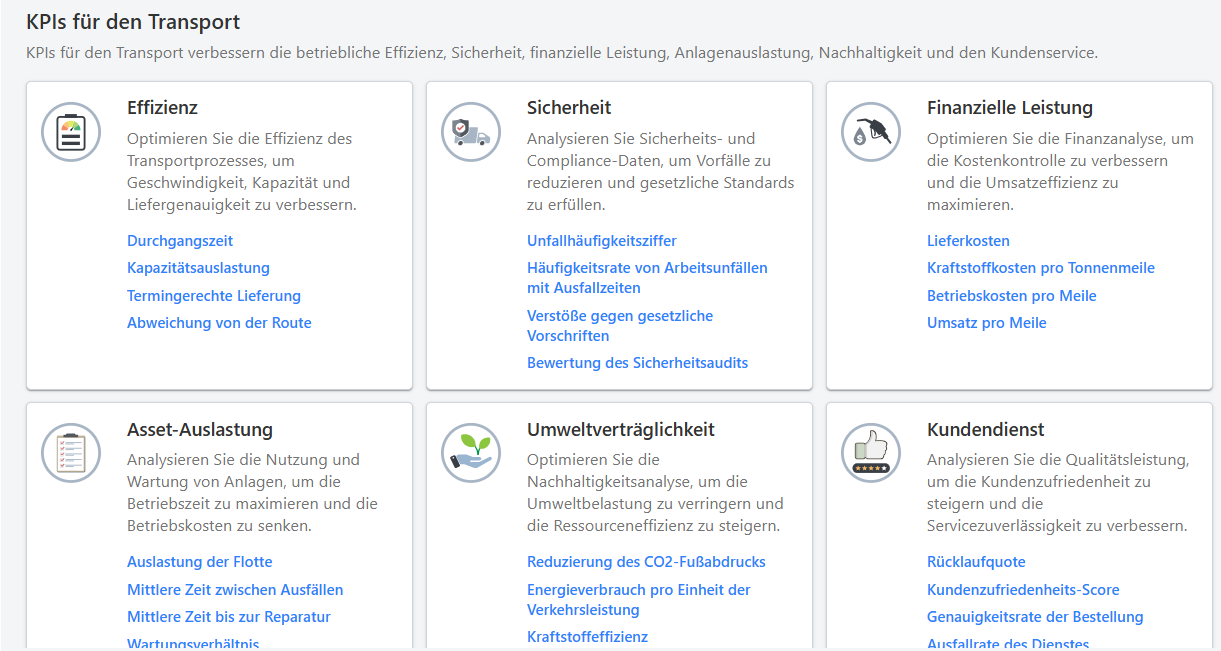
Module "Transportation"
New in Minitab 22.3.1, the Transportation module provides transportation professionals with tools to quickly begin analyzing data in the areas of operational efficiency, safety, financial performance, asset utilization, environmental performance or customer service. Guided analyses are available for transit time, accident rate, revenue/operating cost per kilometer, maintenance ratio, fuel efficiency or customer satisfaction score, among others.
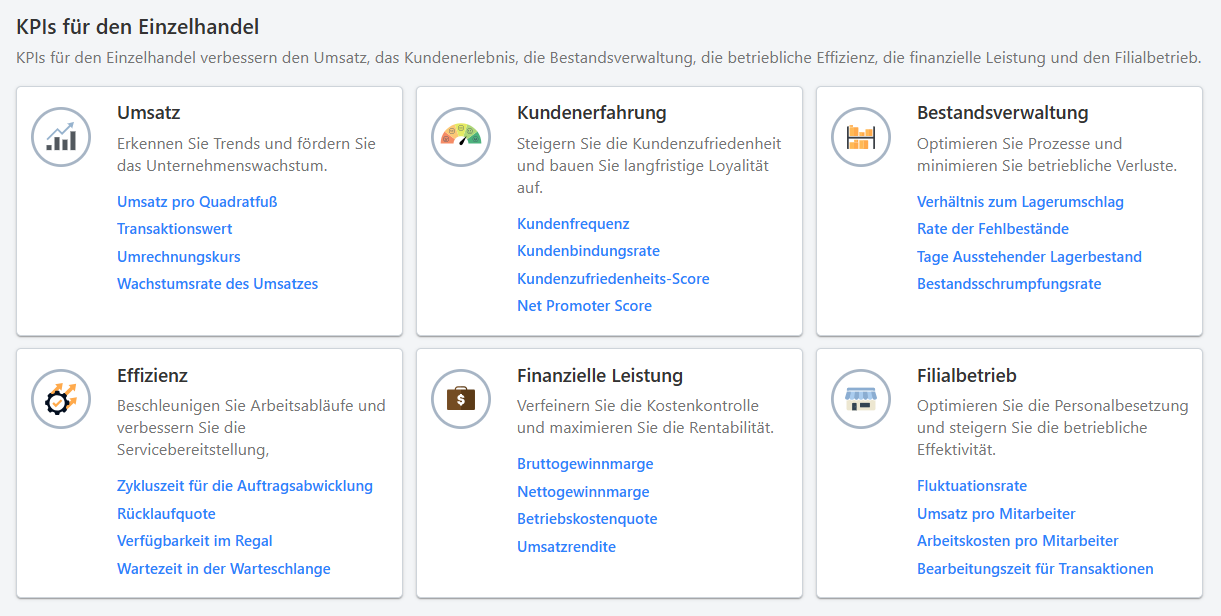
Module "Retail"
The new Minitab module "Retail" enables retail professionals to quickly perform meaningful statistical analysis to maximize sales, improve customer experience, optimize inventory management processes, increase operational efficiency, monitor financial performance or ensure efficient store operations.
Short Overview of new features in Minitab 22.3
Minitab 22.3 includes numerous new functions and enhancements in the area of data analysis and visualization.
Visualizations
Wafer Plot
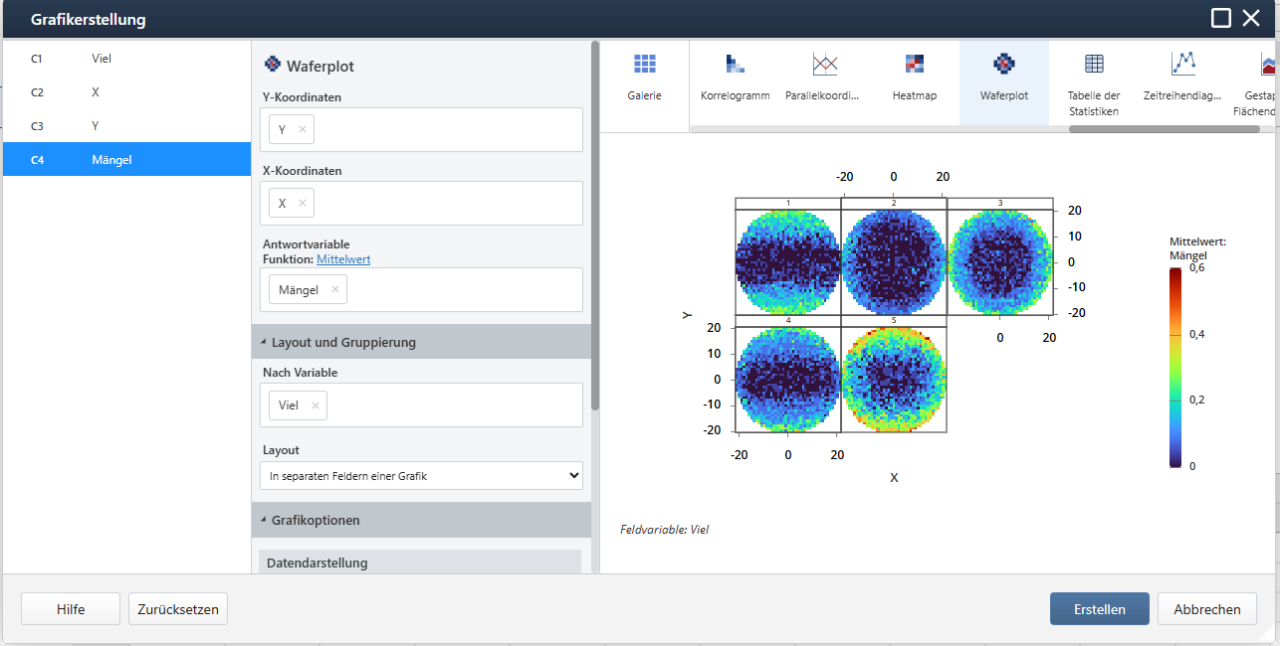
The new Wafer Plot in Minitab 22.3's interactive Graph Builder is a specialized heatmap that helps engineers in semiconductor manufacturing to visualize the performance or distribution of defects of semiconductor devices on a wafer. This tool is crucial in identifying potential root causes of manufacturing issues and facilitates the application of statistical process control methods to monitor and improve manufacturing processes.
Boxplot Y-scale Log Transformation
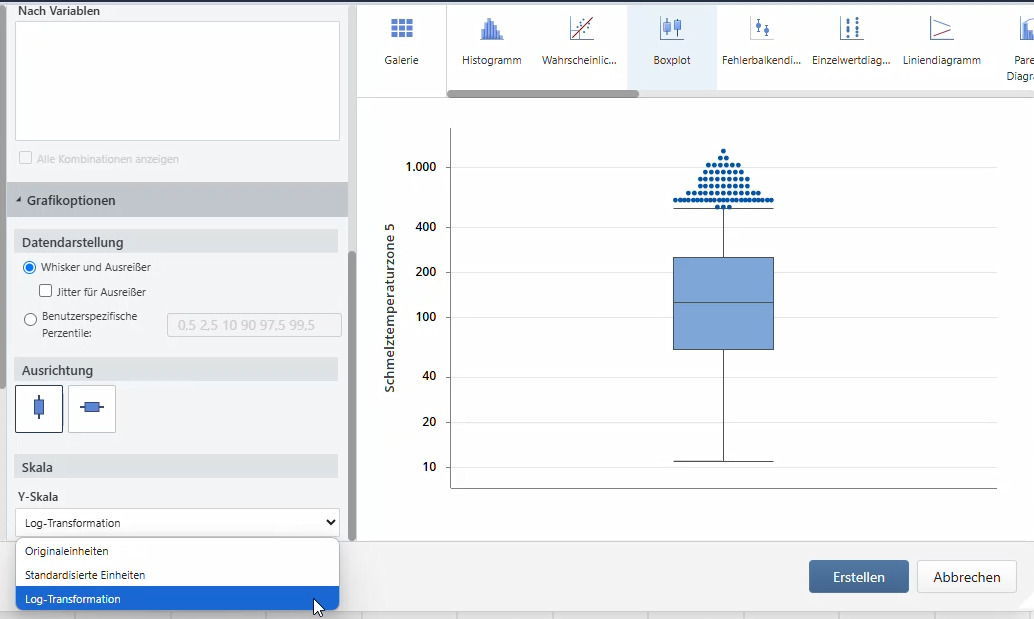
For visualizing highly skewed continuous data or data with extreme outliers, the Graph Builder in Minitab 22.3 and later offers the option to apply a logarithmic transformation to the Y-axis of a boxplot. This is helpful when trying to visualize the distribution of continuous data when it is highly skewed or affected by extreme outliers and improves the understanding of the data distribution.
Data Analysis
Quick Designs
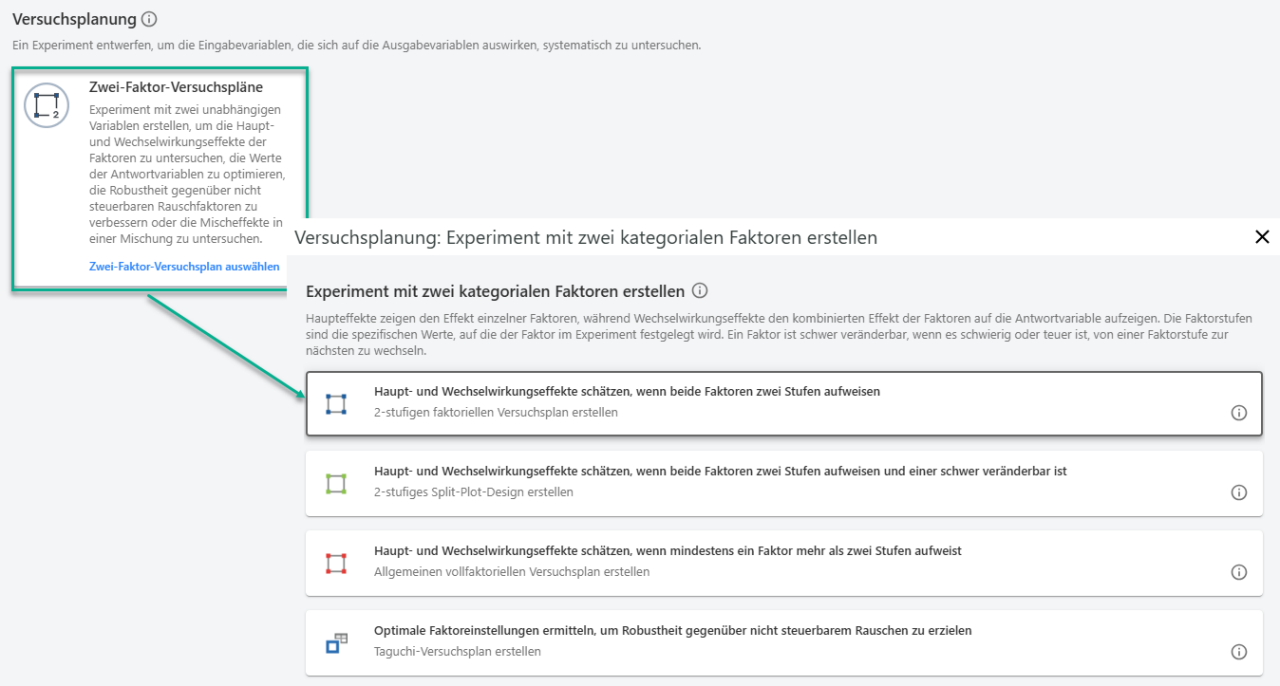
In Minitab 22.3, “Quick Designs” is a new, guided dialog in the DoE menu that supports the selection of the appropriate design for the individual question. Given the variety of available design types, this tool provides valuable guidance. It includes the most commonly used design settings for: Definitive Screening, Factorial, General Full Factorial, Response Surface, Mixtures, and Taguchi designs.
Short Overview of new features in Minitab 22.2
Minitab 22.2 optimizes workflows and analysis results with advanced predictive analytics and visualization functions.
Predictive Analytics Module Update
Binary Logistic Regression and Linear Regression
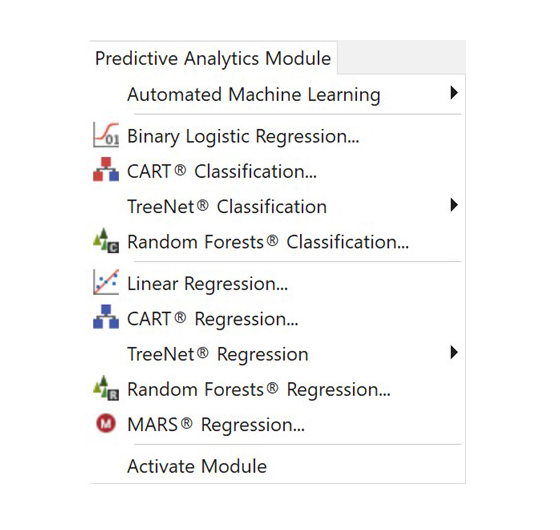
In Minitab 22.2, binary logistic and multiple linear regression models can now be created directly from the optional, chargeable “Predictive Analytics” module. This makes it possible to visually examine relationships between predictor and fitted response values using factorial, contour, and surface plots. In addition, combinations of predictor values can be determined that optimize the response and also generate predictions.
Improved Post-Analysis Workflow
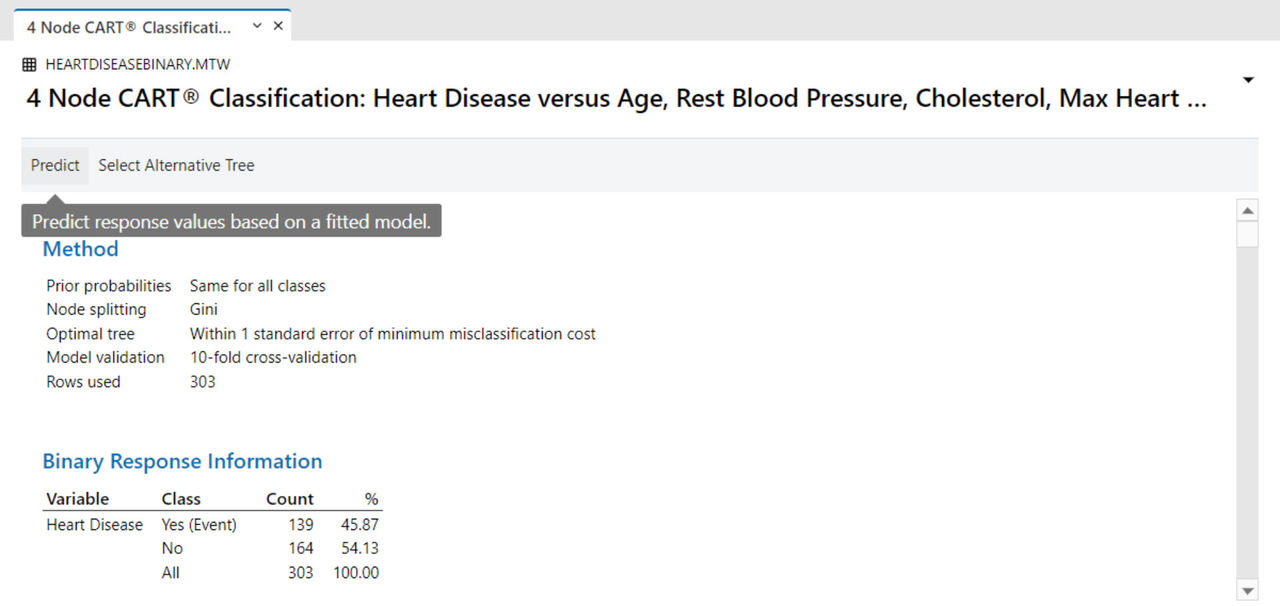
The options after an analysis in the Predictive Analytics module, such as prediction or selecting an alternative model, are available more quickly from Minitab 22.2 in a toolbar at the top of the results, so that you no longer have to scroll through the model output.
Visualizations
Graph Builder Update: Date/Time Data Support for Several Graphs
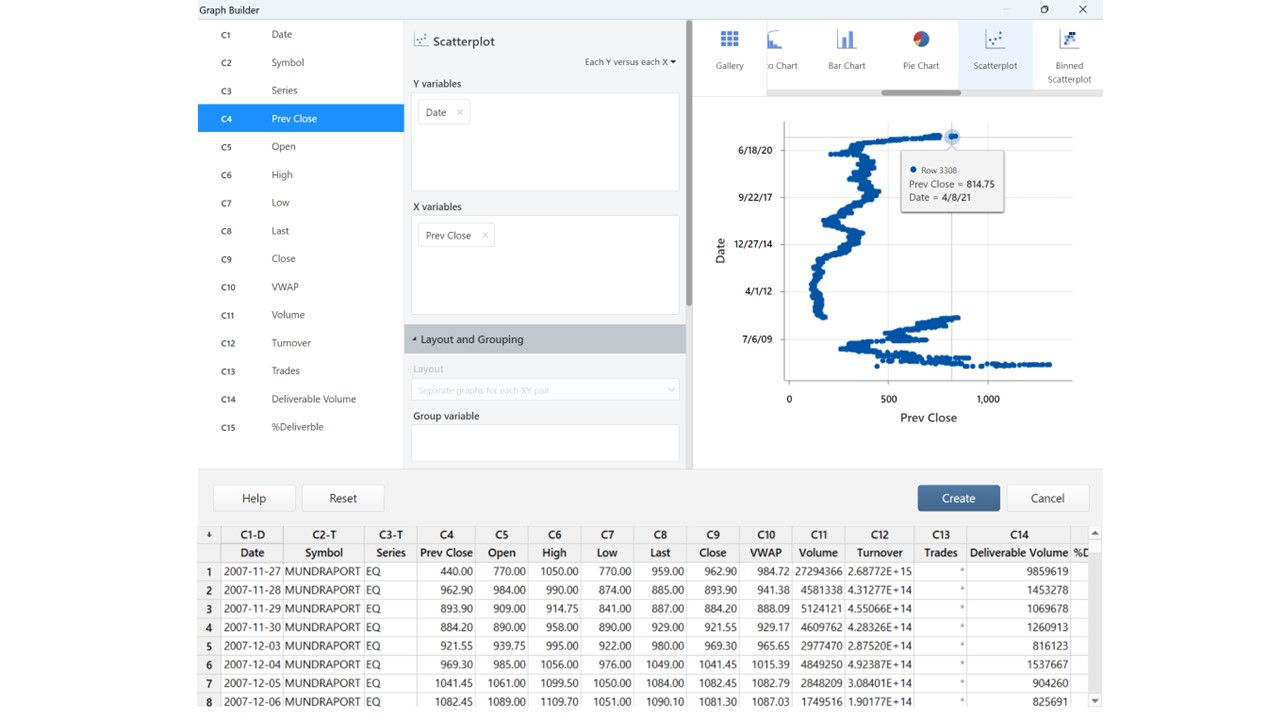
Columns with date/time data can be selected as continuous or categorical variables for Boxplot, Scatterplot, Individual Value Plot, or Interval Plot using the Graph Builder from Minitab 22.2. For categorical variables, it is possible to specify specific units (e.g. year, quarter) to display categories in the graph.
Combination Control Charts Support Unique Y-value Reference Lines (Desktop Only)
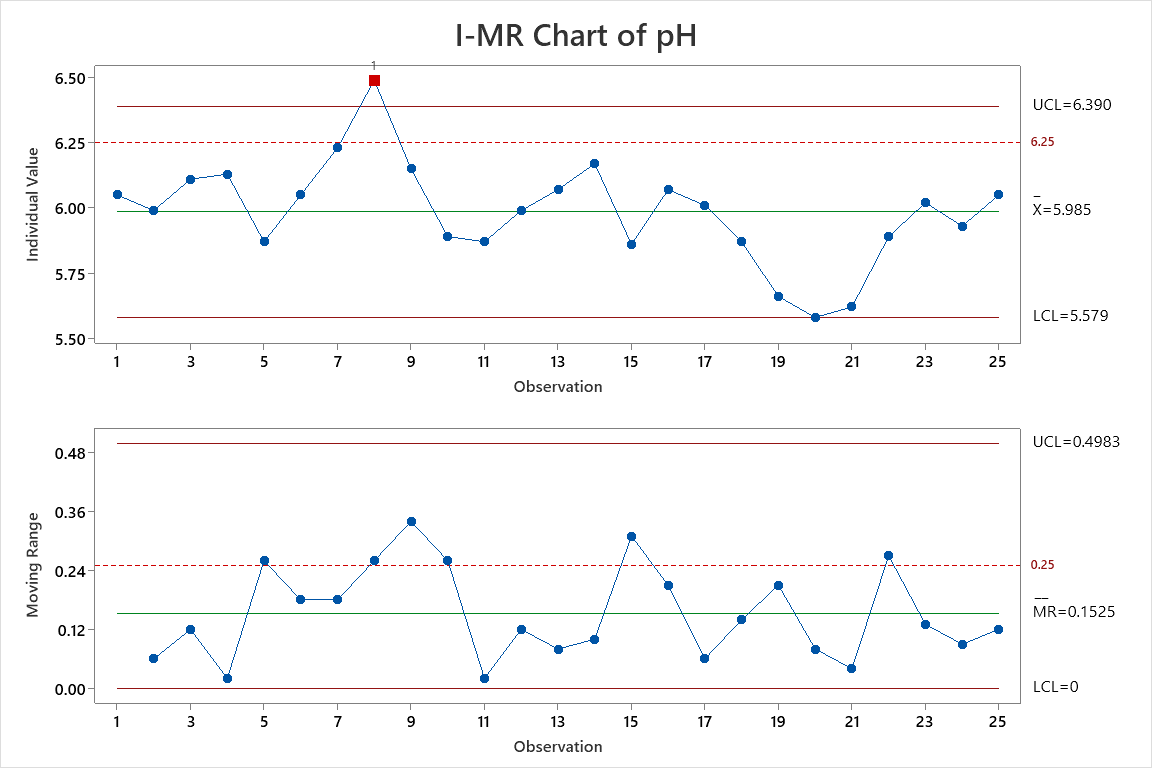
In the Minitab desktop application, unique reference lines for Y values can be added to each individual graph in a combined control graph (e.g. an I-MR graph). These reference lines are retained when the graph is updated due to changes in the source data.
Short Overview of new features in Minitab 22.1
Extended Statistical Methods
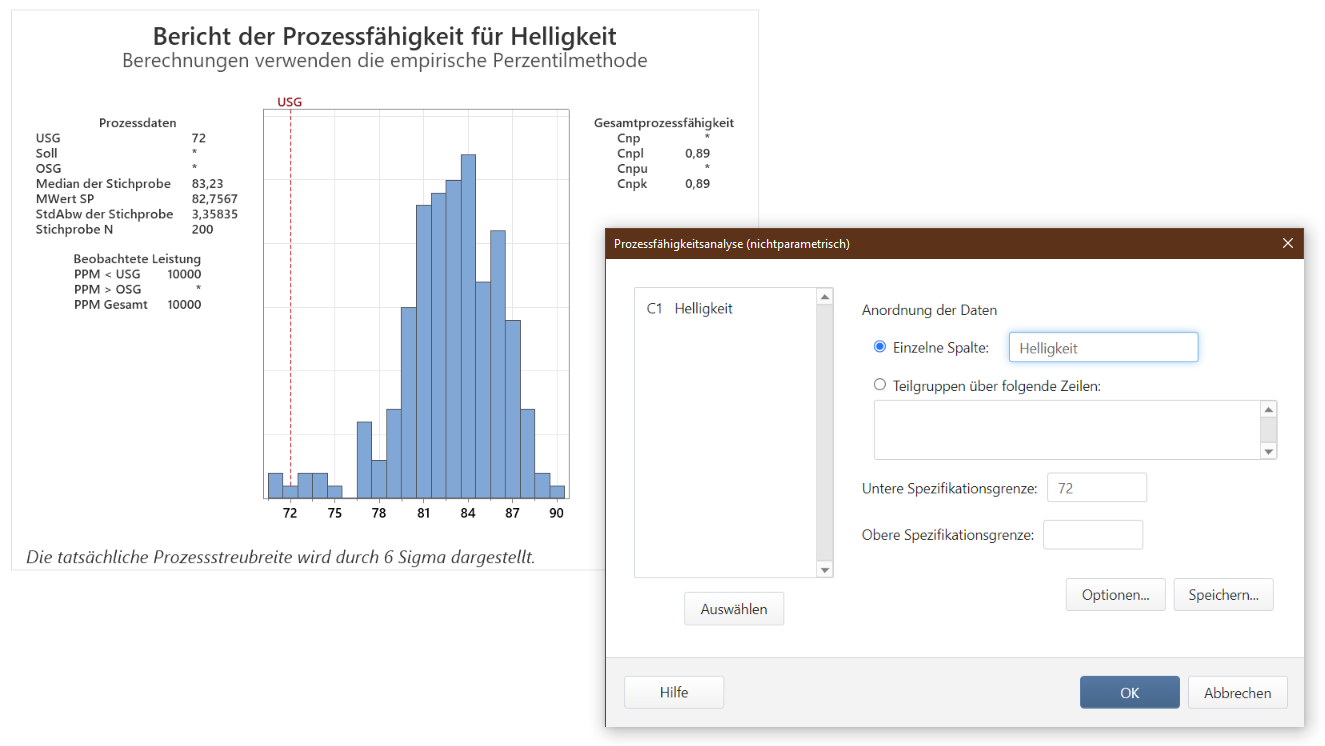
Nonparametric Capability Analysis
With the non-parametric process capability analysis, Minitab 22 offers a reliable solution for evaluating the performance of a process when no distribution or transformation is suitable. The non-parametric process capability can be found in the menu "Stat > Quality Tools > Capability Analysis".
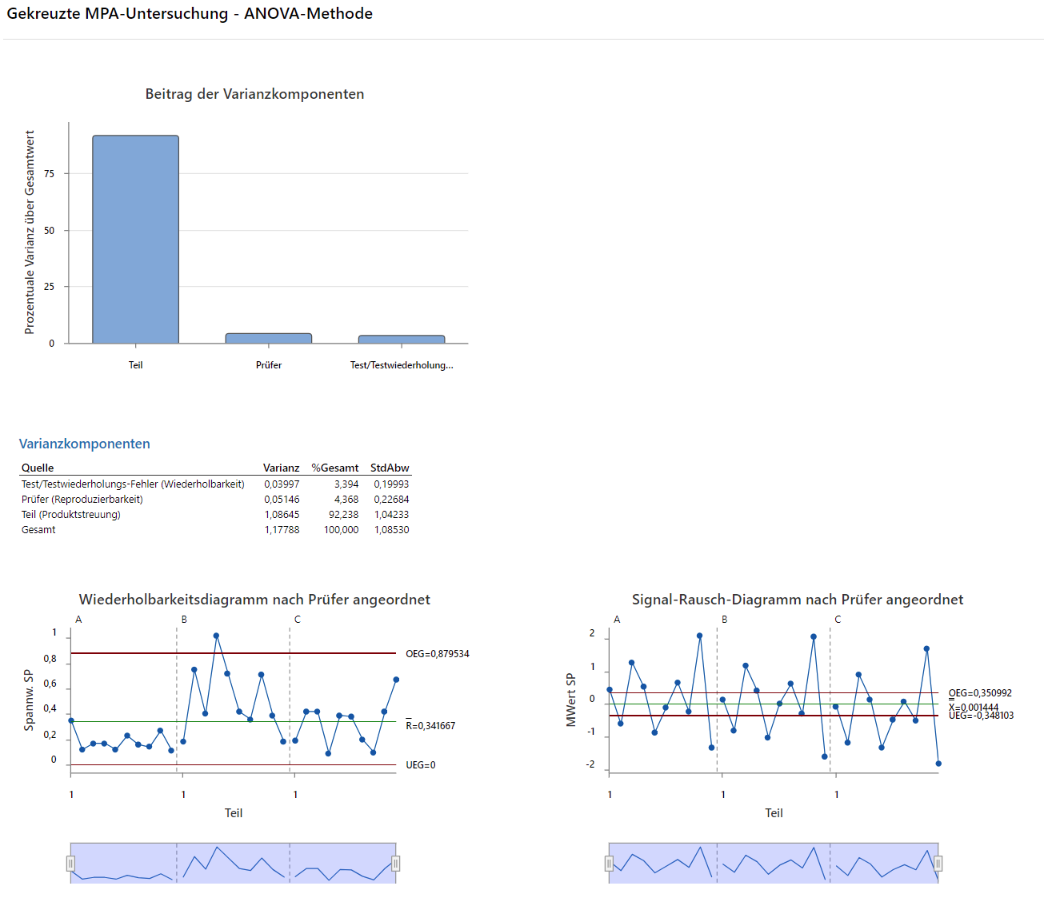
Evaluate Measurement Process (EMP Crossed)
The Evaluating the Measurement Process method (EMP crossed) provides the evaluation tools for the process variation in a measurement system with crossed designs using the preferred Wheeler‘s EMP criterion. Thus, this evaluation method in Minitab 22 offers a new alternative to the existing measurement system analysis tools. You can find the corresponding command in the menu "Stat > Quality Tools > Gage Study".
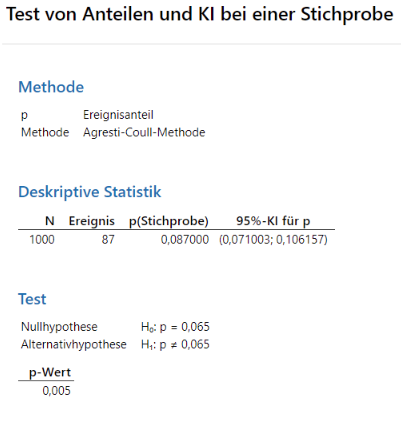
Improved Hypothesis Test and Confidence Intervals
Several improvements have been made to the hypothesis test and confidence intervals. Minitab 22 includes additional methods to improve the accuracy and appropriateness of results, including Wilson-score and Agresti-Coull. Moreover, users have the option to define the event value in the dialog now.
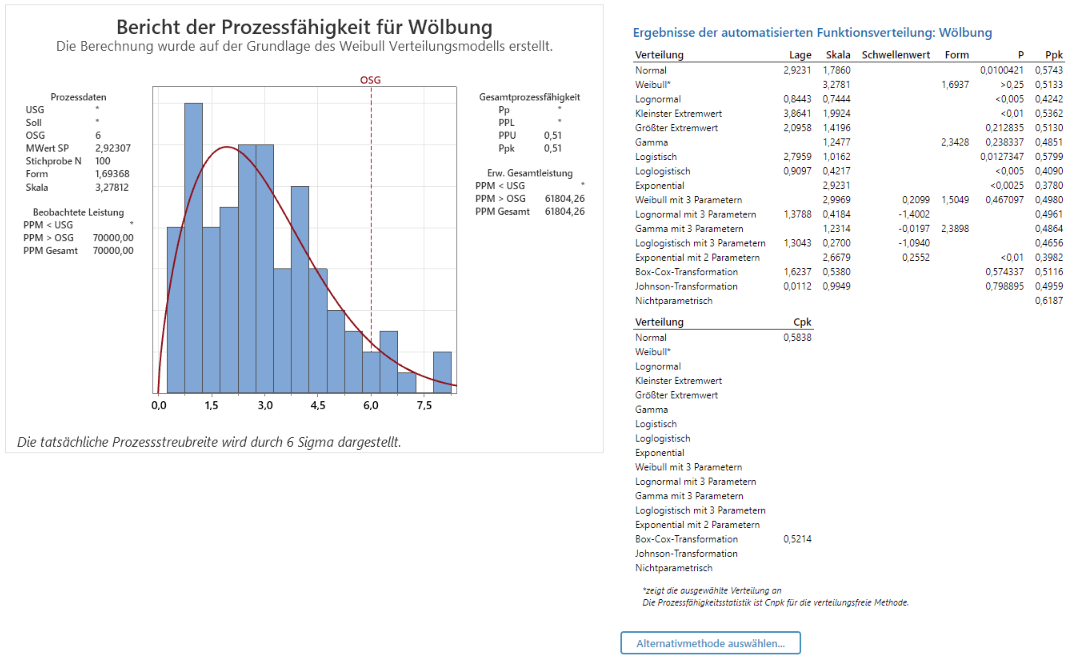
Automated Capability Analysis
The automated process capability analysis newly introduced in Minitab 22 automatically determines a suitable distribution for the process capability analysis based on plausibility and p-value. If no distribution is suitable, a transformation or a nonparametric estimation method will be used. The method can be found in the menu "Stat > Quality Tools > Capability Analysis".
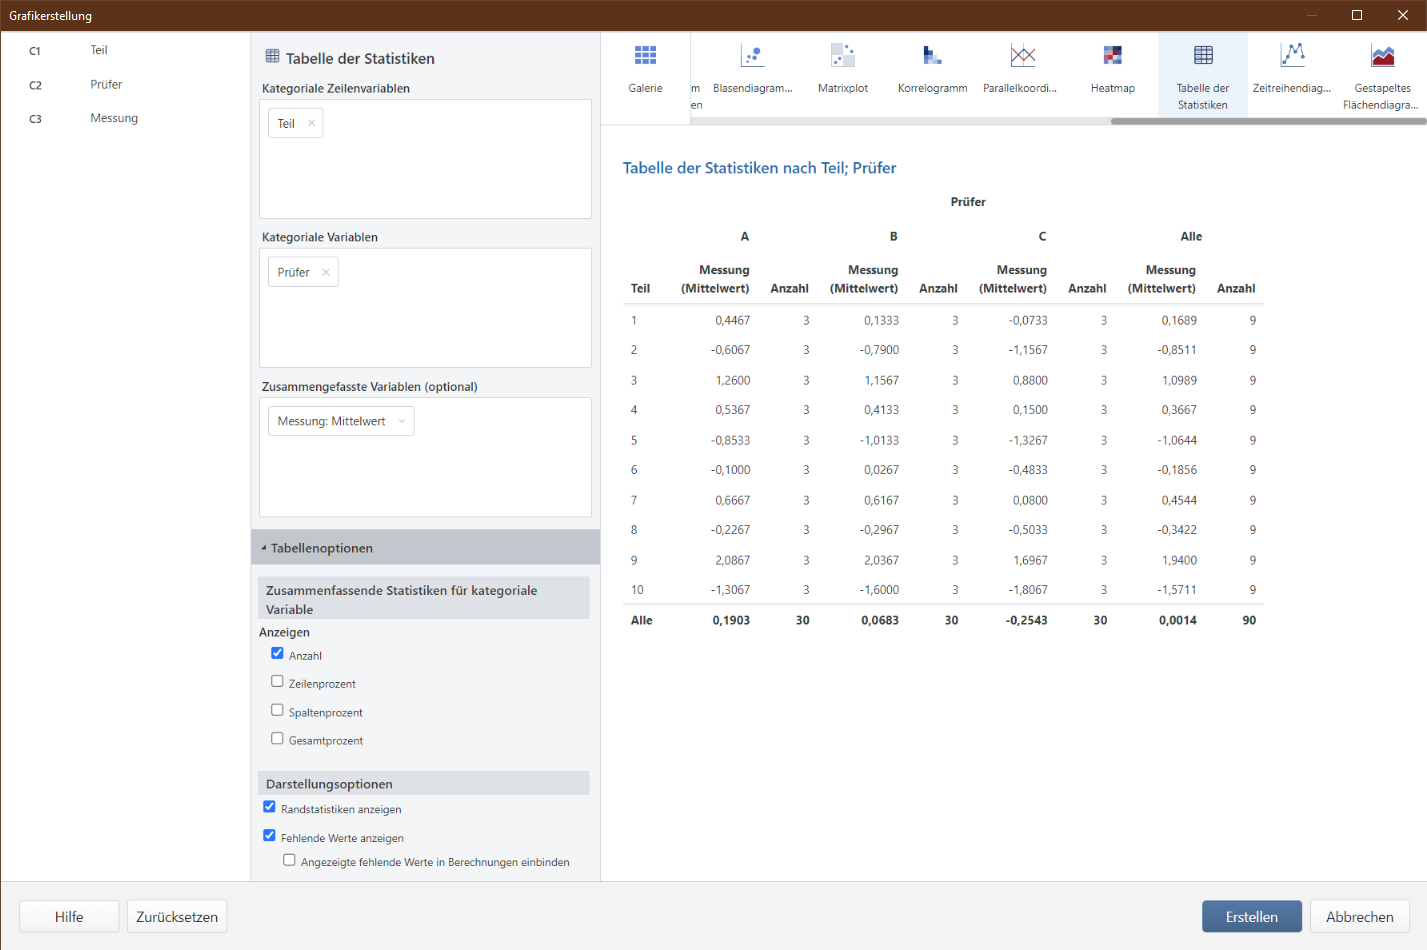
Interactive Table Builder
Mit der interaktiven Funktion "Tabellenerstellung" in der Grafikerstellung sowie der Live-Vorschau lassen sich Zusammenhänge zwischen Variablen jetzt noch besser interaktiv untersuchen und aussagekräftige Statistiktabellen per Drag-and-Drop-Oberfläche erstellen. Die in Minitab 22 neu gestaltete Tabelle verbessert die Lesbarkeit und das Gesamterlebnis für den Benutzer.
Enriched Visualizations
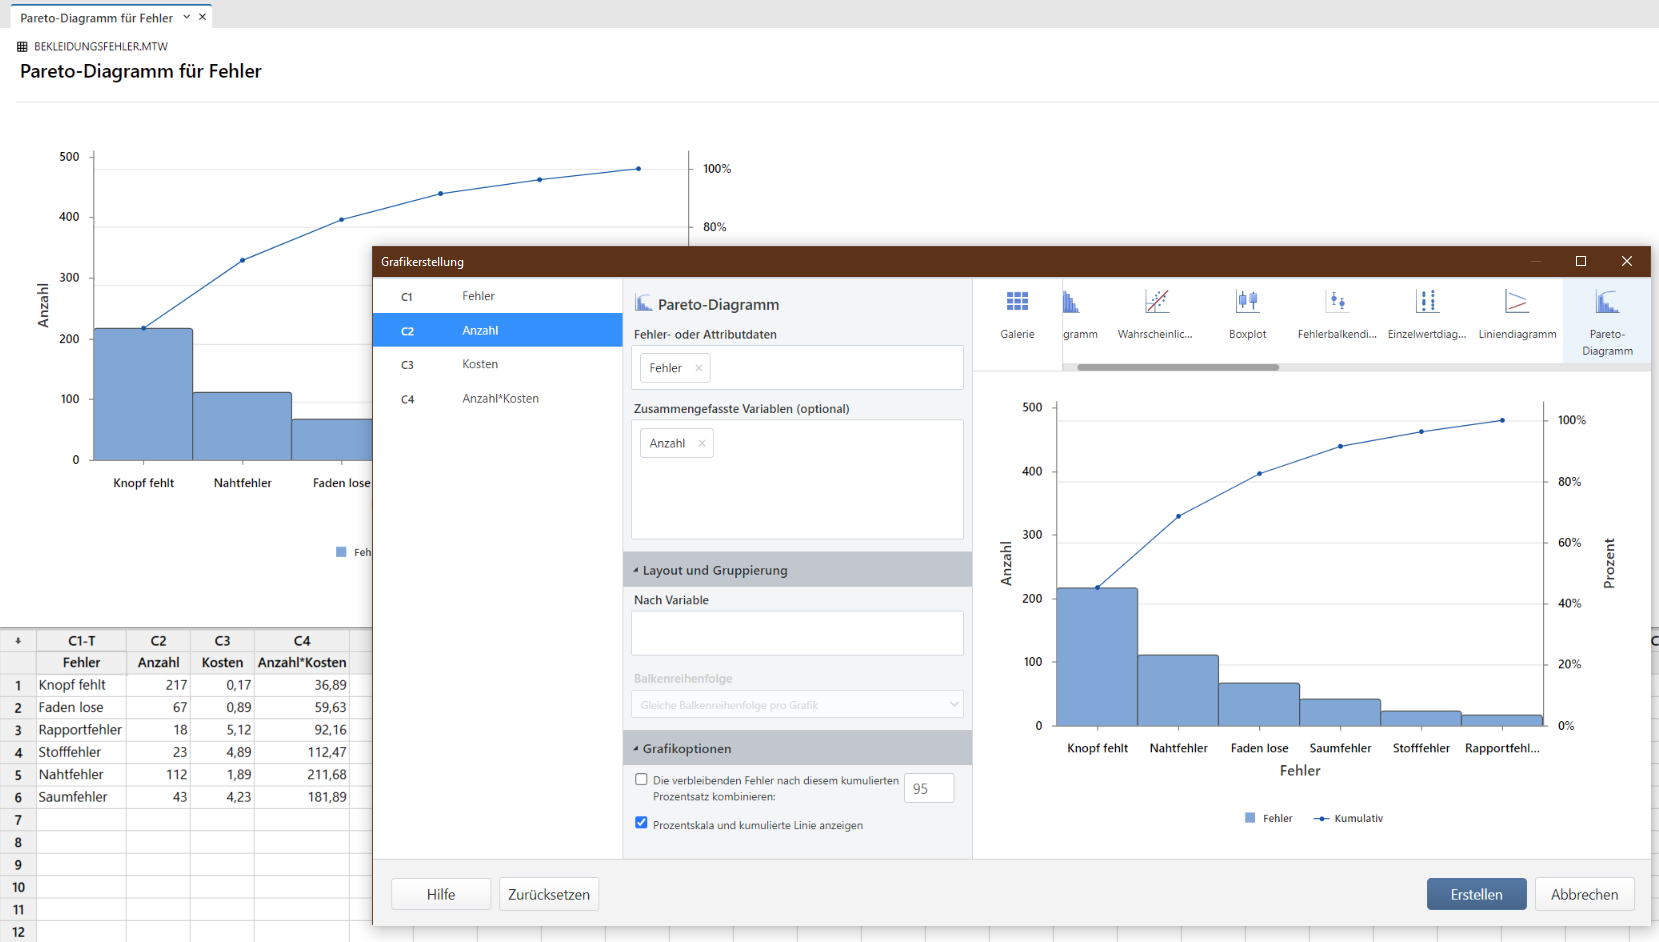
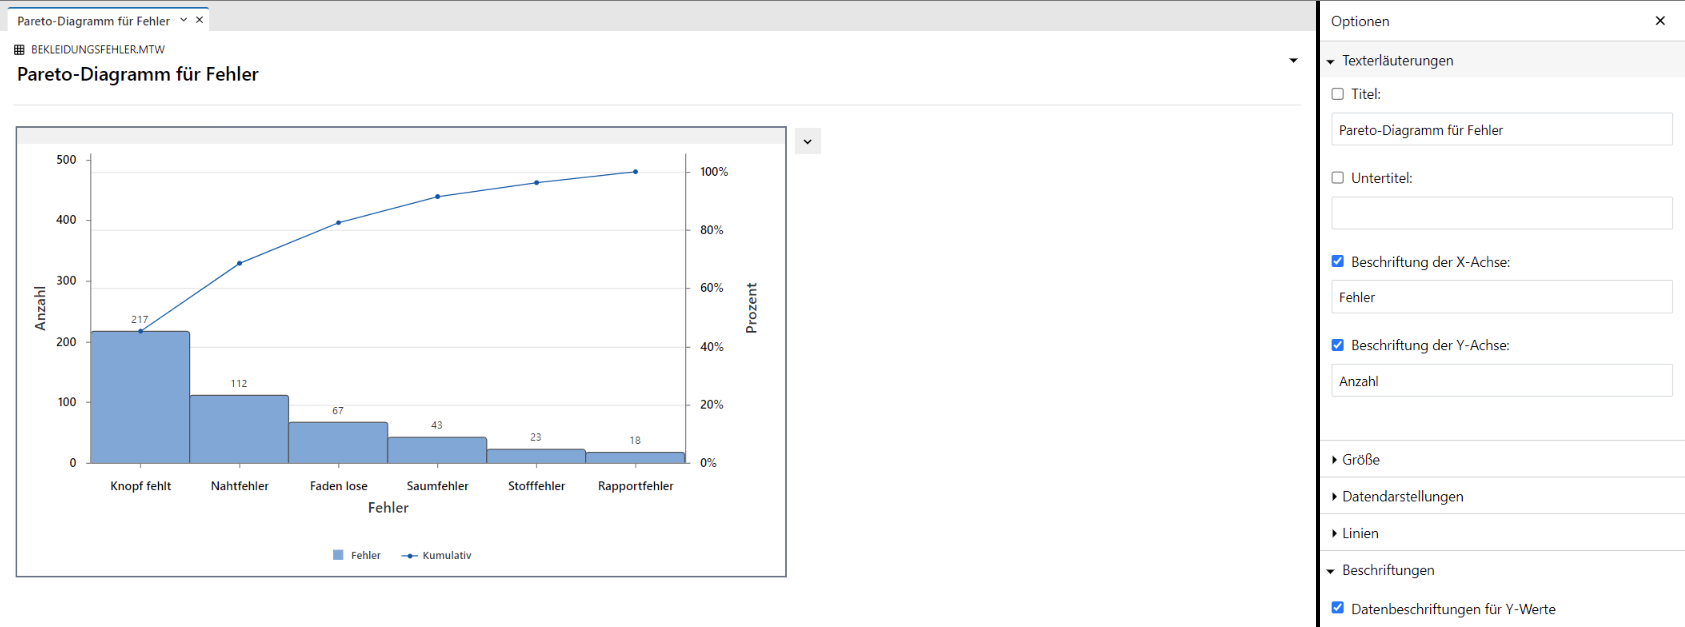
Interactive Pareto Chart in Graph Builder
As of Minitab 22, the Graph Builder includes an interactive tool for Pareto charts, which can be used, for example, to identify the errors to be prioritized or the feature that contributes most to a result.
Enhanced Graph Editing
Results can be interactively customized by using the new graph editing capabilities:
- Show/hide gridlines at major tick positions
- Add reference lines on continuous scales in existing graphs
- Add Y-value data labels for primary data depictions in an existing graph
- Customize graph size with an option to maintain the aspect ratio of the graph when a dimension is specified