


New graphics tools in GAUSS 19
New suite of tools for time series plotting
High-frequency and irregular data
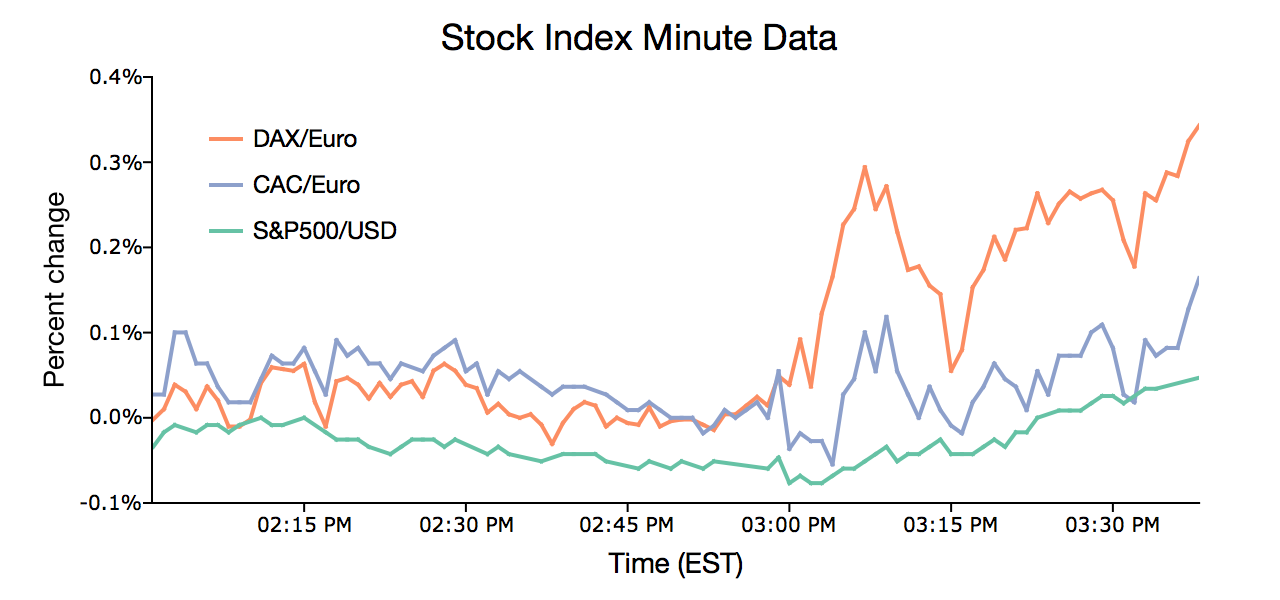
The new function plotTSHF supports
- Irregularly spaced data, such as tick data.
- Many frequencies such as milliseconds, seconds, minutes, hours, days, months, quarters and years.
Log scaled Y-axes
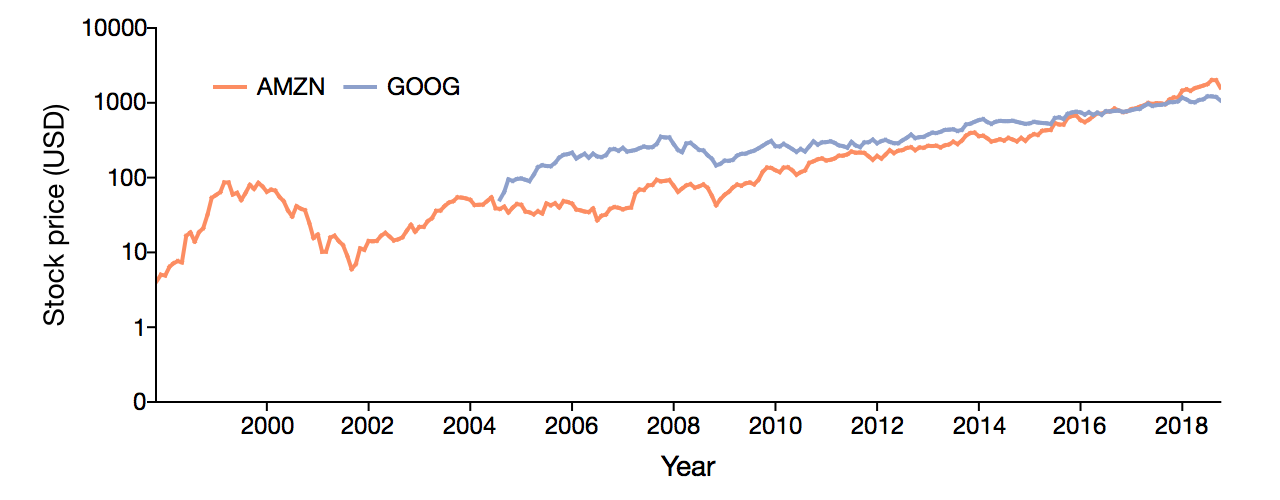
New functions plotTSLog and plotAddTSLog create time series plots with the Y-axis in log space.
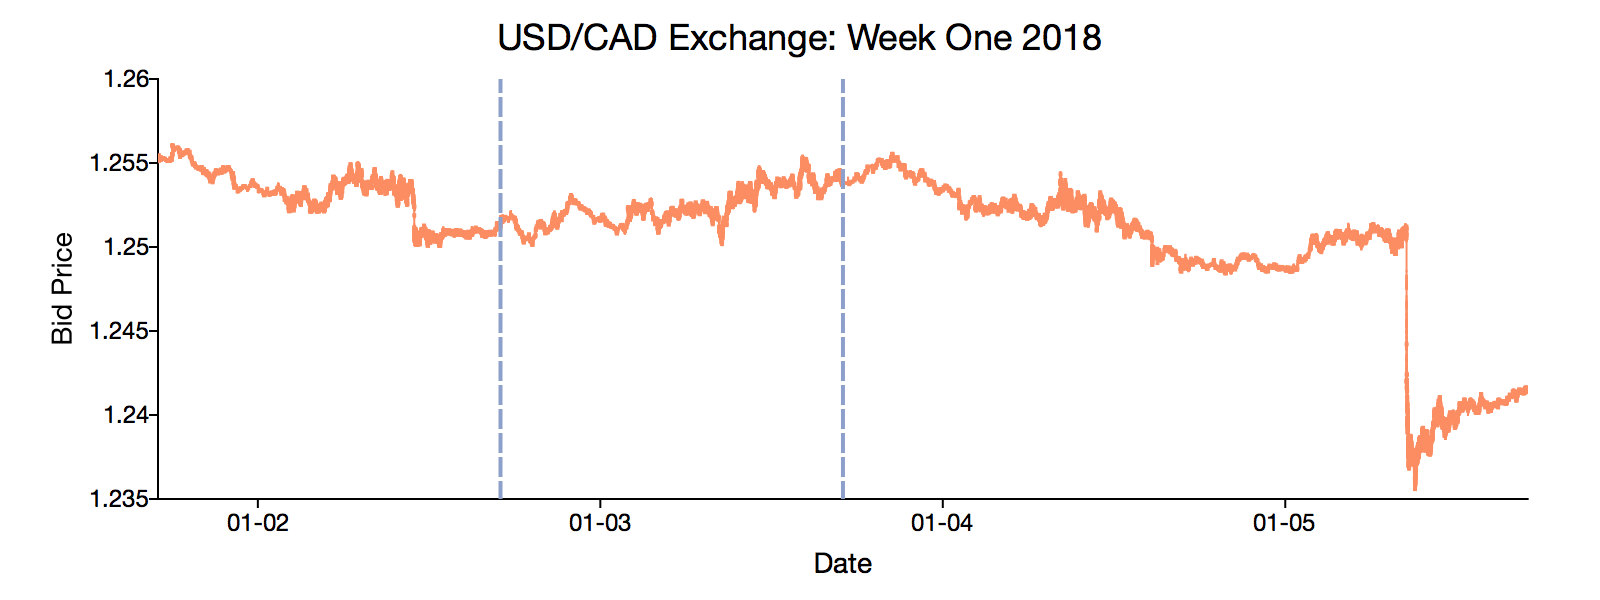
plotTS supports daily data
Expanded formatting options
Simple controls for tick locations
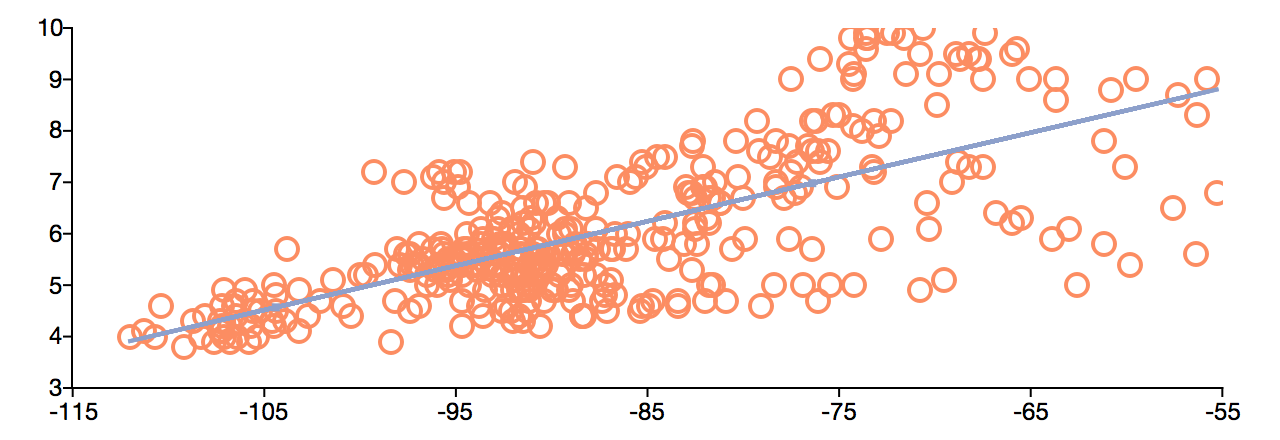
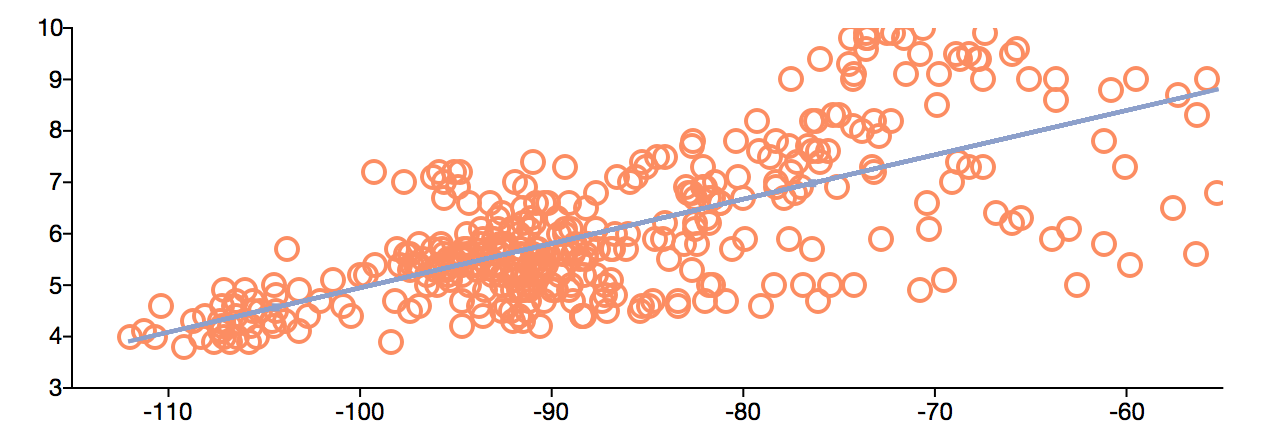
Specify the location of the first X-tick label location to be -110 and the interval between ticks to be 10 and GAUSS takes care of the rest.
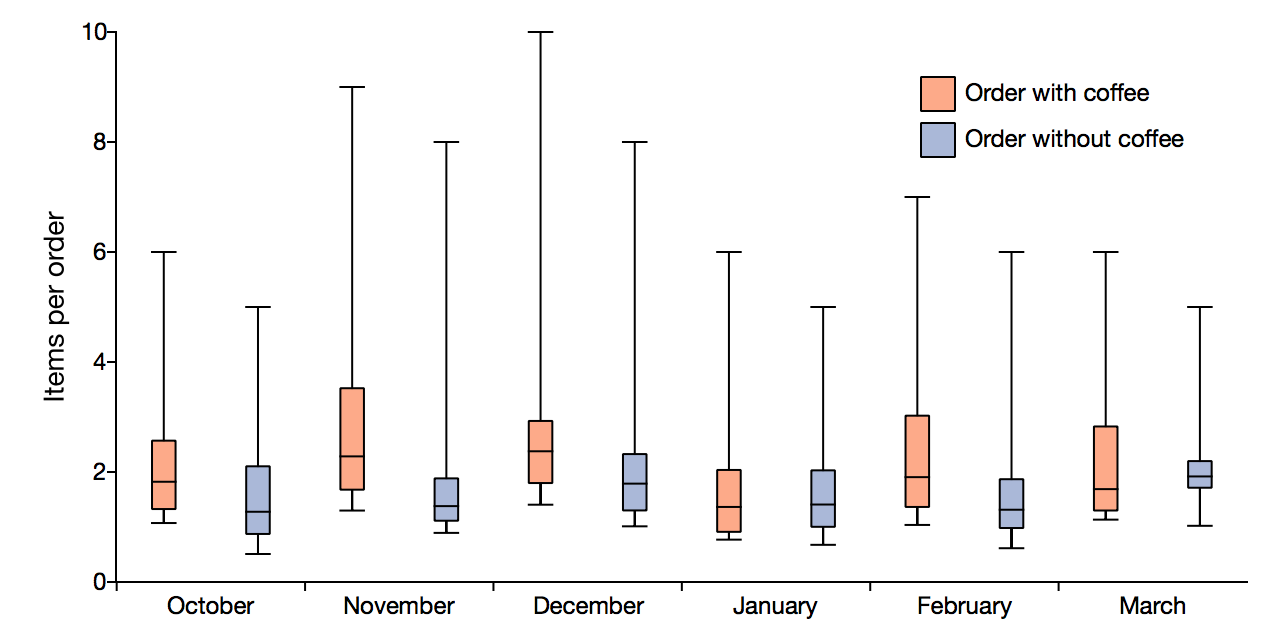
More control for box plot grouping
Grouped boxes
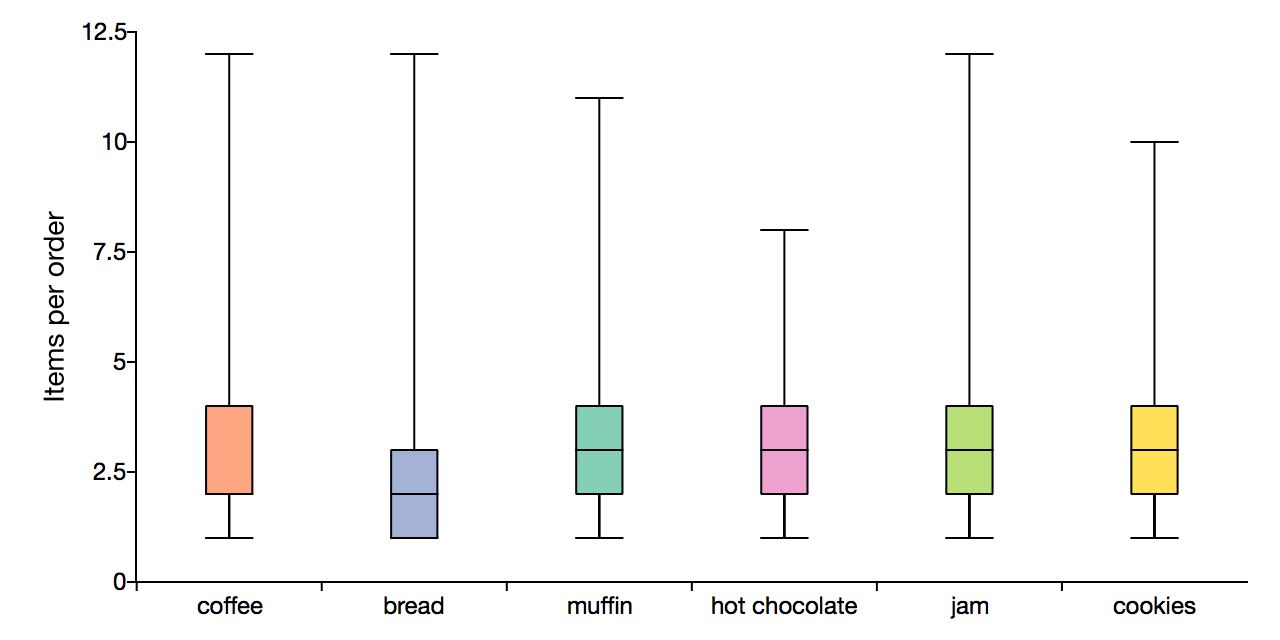
Un-grouped boxes
Other new formatting functions
- plotSetYTicLabel controls the formatting and angle of Y axis tic labels.
- plotSetLegendBkd controls the color and opacity of the legend background.