UNISTAT
UNISTAT is a software for statistics, data analysis and reporting with a seamless interface to Microsoft® Excel. UNISTAT was developed as a statistical package back in 1984 and has been used by scientists and researchers in commercial and academic applications ever since. If Microsoft Excel is to be used as the basis for statistics, UNISTAT is the standard for applications thanks to its Microsoft Office integration and, in particular, the Excel add-in mode. UNISTAT is very popular in areas where documented algorithms, accuracy and a validated statistical system are required, such as in pharmacology and the life sciences.
Properties of UNISTAT
- easy to use and learn
- includes all necessary statistics and graphics routines
- offers Excel for data input
- can be integrated into existing program environments
Overview
Overview
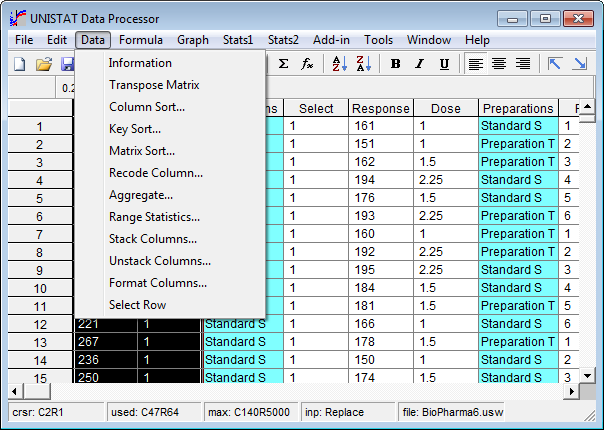
UNISTAT can be used as a standalone program or as Excel add-in.
The UNISTAT user interface is easy to use and, despite its wide range of functions, is clearly laid out and can be used individually. Well-arranged menus and easy-to-understand toolbars ensure that every user immediately achieves their goal, i.e. their analyses and evaluations. The help function with examples and references assists the user in every step of their work. In addition, data management adapted to spreadsheets such as Microsoft
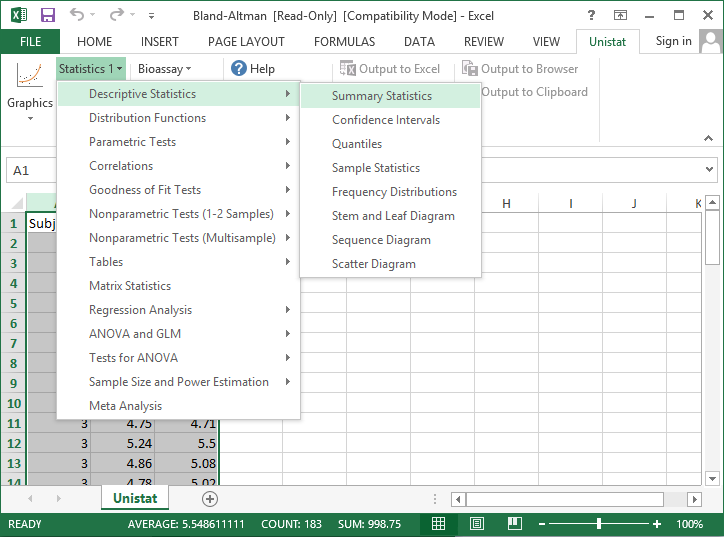
If Excel is already being used, the UNISTAT Excel add-in offers a particularly convenient application option. Excel users can use all UNISTAT functions directly in Excel. The familiar user interface has several menu items which can be used to execute the UNISTAT statistical and graphic functions within Excel. The procedures then executed access routines in UNISTAT, carry out the desired evaluations and return the result directly to the Excel table. The user does not have to leave Excel and is not reminded that UNISTAT is behind these evaluations.
Data Import and Export
Data Import and Export
UNISTAT can read and write the following file formats:
- UNISTAT
- Excel Lotus 1-2-3
- Text
- Sylk
- DIF
- Access
- dBase
- FoxPro (*.dbf) (only Import)
- Paradox (*.db) (only Import)
- HTML
In addition to these import formats, UNISTAT can open all database files that are not directly supported by UNISTAT but for which ODBC drivers are installed in the Windows system.
The SQL dialog enables the creation of SQL statements to extract a subset from a large database.
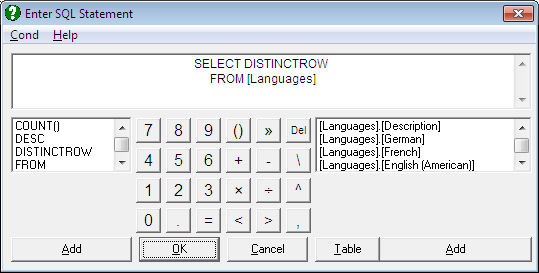
UNISTAT SQL dialog
Graphics
Graphics
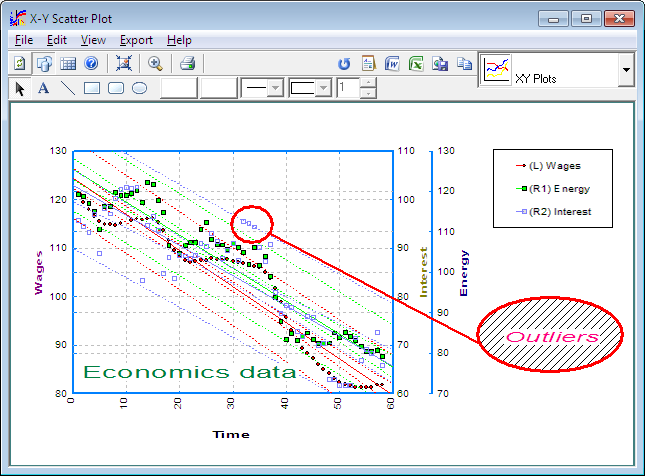
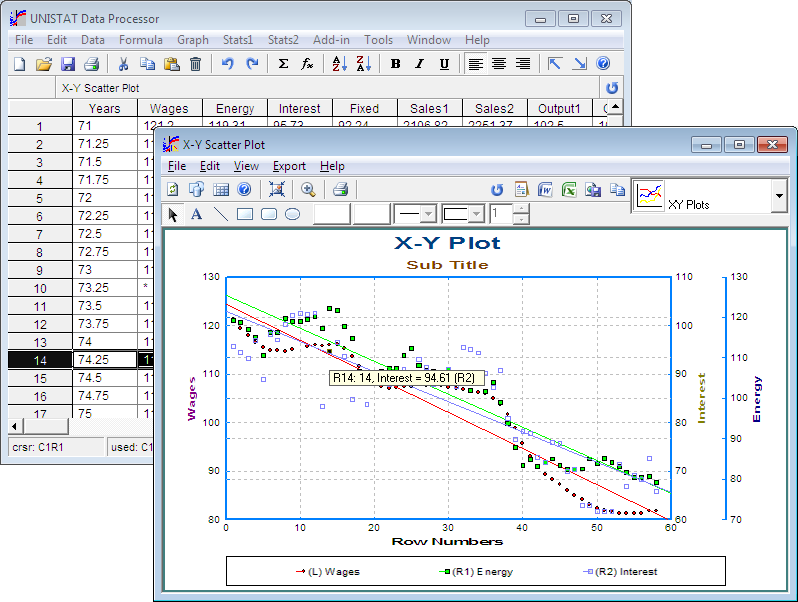
UNISTAT supports the complete editing of graphics. Sizes and positions of texts, legends or the graphic itself can be adjusted using drag & drop and new text and shape objects can be added. You can save these changes as a graphic template and control all graphic attributes such as fonts, colours, titles, legends, axes, frames, tick marks, line types and line thickness via the graphics menu.
There are several options for the different diagrams, from drawing mean values, error bars, trend lines and confidence intervals to curve and surface fitting. 3D options and interactive graphics are available in UNISTAT, too.
Reporting
Reporting
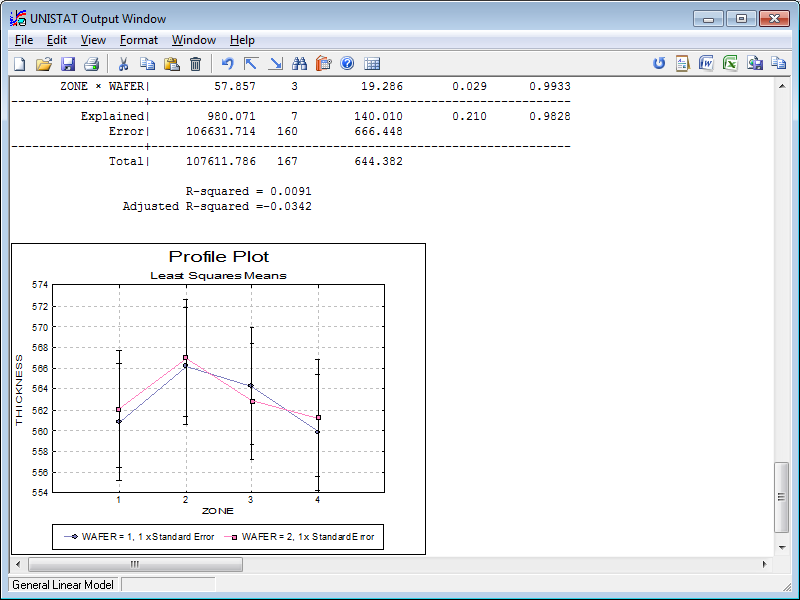
Each evaluation result can only be meaningful if it is prepared accordingly. UNISTAT offers a separate output window for this purpose. All outputs are written there by default. Test outputs and graphics are formatted and clearly arranged here. You can add your own notes and descriptions in the form of text or graphics at any point. This makes the use of an additional word processor for creating reports almost superfluous. However, if further processing is required, the content of the output window can be sent directly to Word, Excel, the web browser or the Windows system clipboard.
Output to Excel or Word
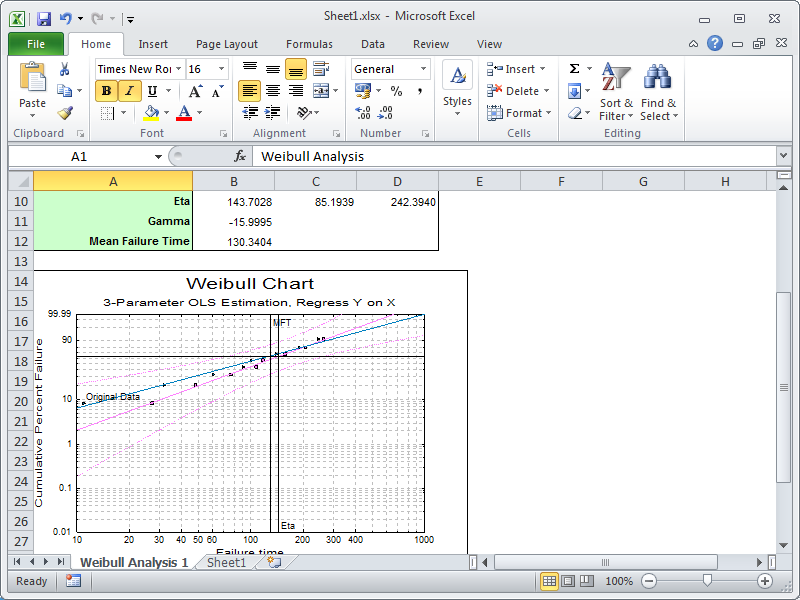
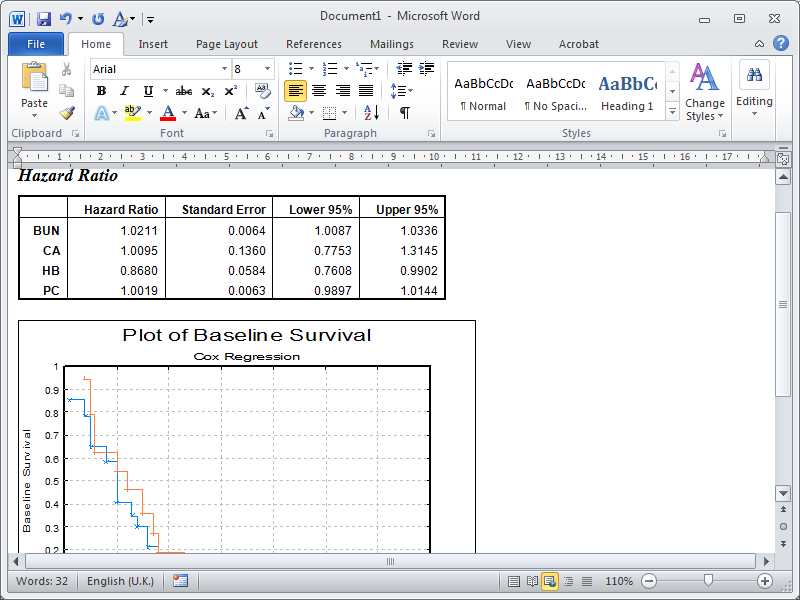
The majority of all users use Word or Excel to create evaluation reports. Therefore, graphics and test statistics usually have to be copied from a statistics program into these Office applications.
Here, UNISTAT enables drastic savings of time and work as output from UNISTAT can be sent formatted directly to Excel or Word. An optional function can be used to switch off UNISTAT's own output window and replace it with Excel or Word. If this function is activated accordingly, Excel or Word is started automatically after a test statistic has been executed. The evaluation outputs are then output in formatted form in this Office application. Further preparation of the data is therefore no longer necessary.
Output to Web Browser
The UNISTAT output is sent to the standard web browser in the form of HTML tables and raster graphics in PNG format.
This output is formatted with CSS, which enables easy integration into websites, wikis, blogs and other web-based applications.
Macros & Developer SDK
Macros
For many areas and applications, it is necessary to repeatedly apply certain analyses and tests to different data sets. In such cases, repeated manual application is not efficient. With the help of the Macro tool, it is possible to automate such workflows.
The required workflow must be recorded during execution. By playing back the recording, the workflow can now be applied to different data as often as required.
This function makes it possible to carry out complete analyses quickly and simply arrange the results, both text and graphics, in a joint report.
Developer SDK
It is possible to run UNISTAT from another application without UNISTAT appearing on the screen. If the developer has an application that requires the use of UNISTAT's powerful data analysis and graphics procedures, UNISTAT can be called from the application in any programming language (C, C ++, C #, VB, VBA, Pascal, FORTRAN, etc.), forwarding data and receiving results. This capability makes UNISTAT a powerful yet flexible programming tool for specialized scientific software developers.
When running UNISTAT in developer mode, each target PC requires a separate UNISTAT license.
Not all product information on our website is available in English, but our sales experts are happy to assist you. Please schedule a consulation appointment via email at