
")


What is new in ConceptDraw PROJECT 10
ConceptDraw PROJECT 10 brings a set of features focused on the project data representation enhancements. The visualization of project data supports effective project management, especially when talking about multiple projects. Displaying the current data on tasks completion status and project baseline values in a graphical form provides professional project managers with the great ability to view the entire picture of the project progress.
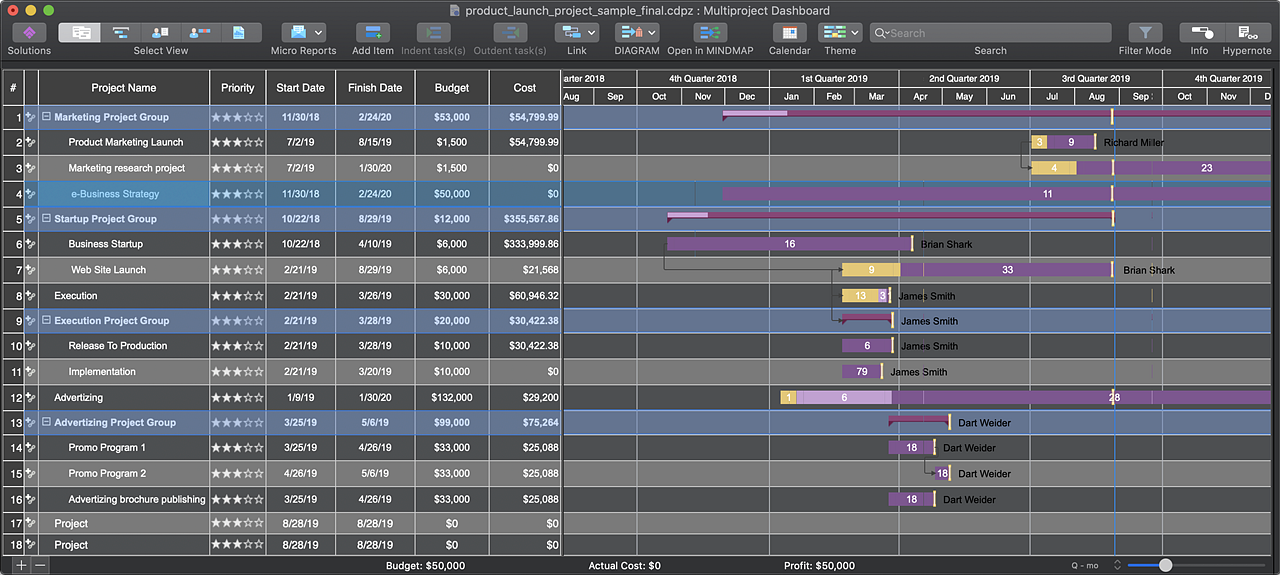
Actual Tasks Completion Status in Multiproject Dashboard
Now you can view the color graphics representation of tasks completion value of each project in the Gantt Chart of the Multiproject Dashboard view. The colored bar represents the situation with the completeness of the project's tasks. You can see the number of completed tasks, the ones in the process, and those that have not been started.
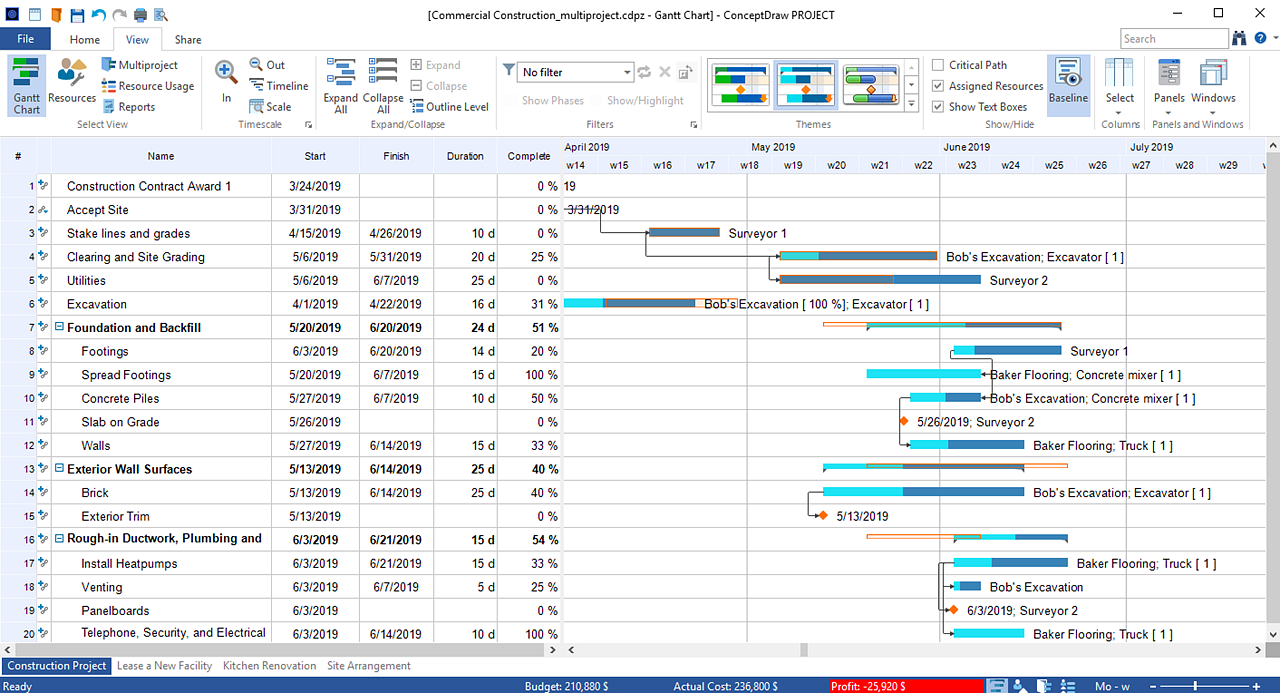
Project Baseline Visualization
The process of tracking baselines in PROJECT becomes easier. Once you have saved a project baseline you can switch on it to the project Gantt Chart view. Being able to see the baseline schedule graphically enables you to compare easily the actual project schedule against the planned.
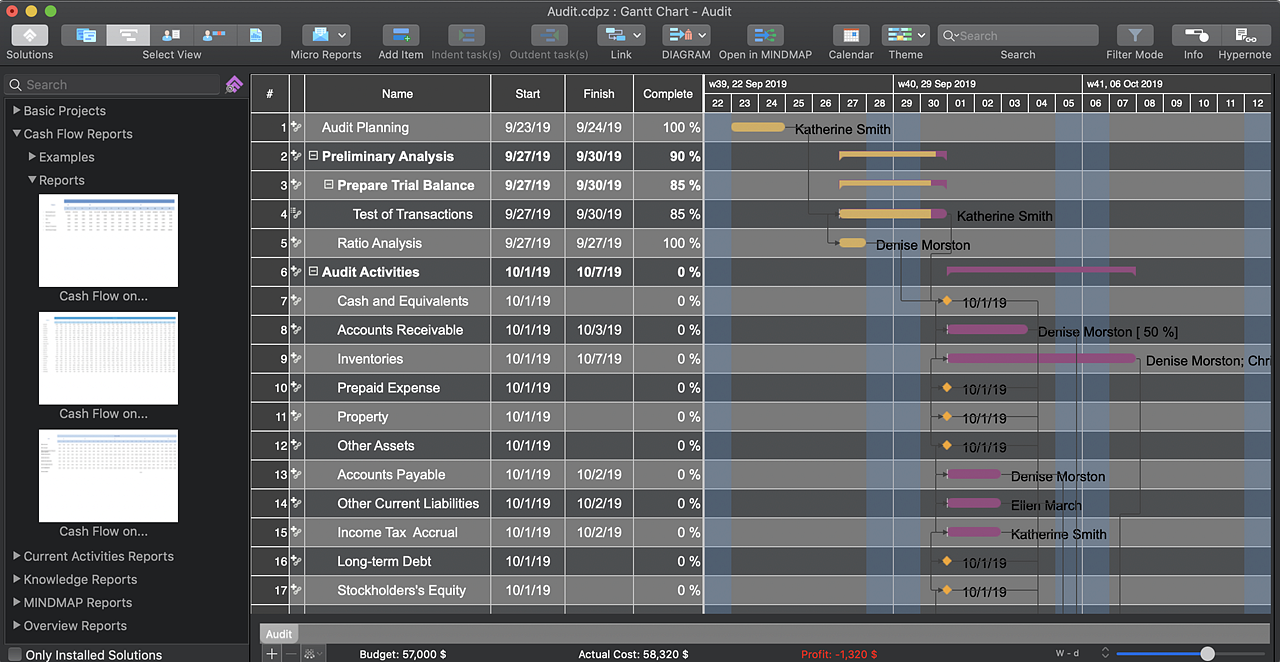
Support of Dark Mode on macOS
Since the macOS Mojave release, Apple allows third-party software to use it. The high text contrast provided in the Dark Mode facilitates the reading of text and graphics documents. Applying dark colors instead of white reduces eye fatigue and improves the perception of projects.
Other Improvements
Added possibility to zoom in/zoom out Gant Chart view using a touchpad.