5015

Enhanced Visualization

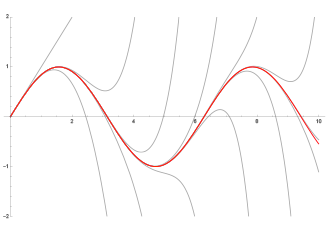
Mathematica Version 10 refreshes the overall aesthetic for visualizations, combining a bolder, unified color scheme across all visualization functions, with new automatic computation of visual attributes such as point sizes, edge styles, surface colors, and axes positioning. Besides the default appearance, a whole set of themes easily and automatically changes how plots look for a variety of situations and uses. The visualization functions are also extended to automatically work on time series, associated arrays, and data with units.

  • New color scheme that unifies all the visualization functions.
  • Plot themes easily change the appearance and focus of graphics.
  • Automatic selection of point sizes depending on the size and distribution of datasets.
  • Unique plot styles for surfaces.
  • Better contrasting colors for people with color vision deficiencies.
  • Filling styles automatically follow the main plot style.
  • Edges in bar charts in histograms automatically fade out as the density increases.
  • Faster rendering of large and complex point sets.
  • Automatic legend construction has been added for vector and stream plots, as well as other specialized visualizations.
  • Plot data directly from associative arrays, automatically using the keys as legend labels.
  • Plot time and event series directly.
  • Use data with associated weights in statistical plots.
  • Plotting data or functions with units automatically detects and converts the units.
  • Plot values, ranges, and inequalities on number lines.
  • Visualize Mandelbrot and Julia sets.
  • Plot locations on maps using a variety of explicit or implicit forms.
  • Color map regions according to associated values.

New Default Styles »

Improved Styles for Color Vision Impairment »

Use Plot Themes to Customize Plots »

Adaptive Point Size Selection »

Adaptive Edge Styles »

FillingStyle »

Adaptive 3D Edge Styles »

Faster Data Plotting  »

Plot Functions Using Units »

Units Improvement  »

Units for Legends »

Use Weighted Data Instead of a Full Dataset »

Plot Time and Event Series »

Plot Keys and Values from Associations »

Plot Values from Associations »

Use Combinations of Wrappers »

Wider Legended Support »

Legend Improvements »

Automatic Vector Legends »

Wider Support for Legends »

Plot the Mandelbrot Set »

Colors Schemes for Julia Set »

Julia Set »

Mandelbrot Set Distances »

Create Number Lines »

Combine Number Lines with Other Plots  »

Plot Values on a Map »

Plot Locations on a Map »