New Version:
Origin 2024
What's New
Origin
Graphing & Analysis
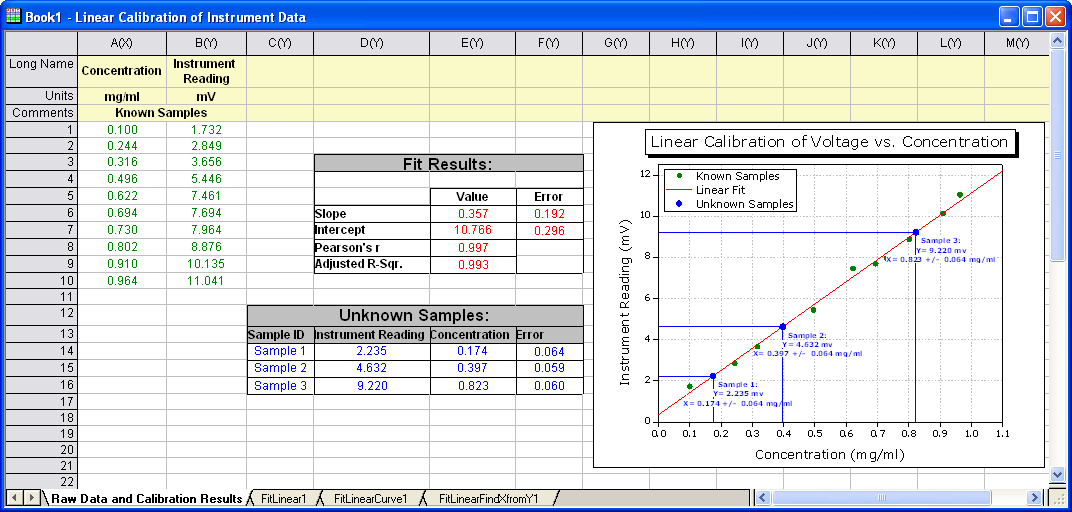
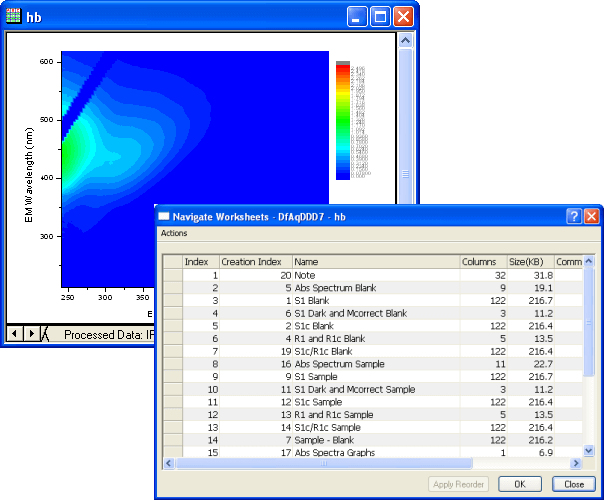
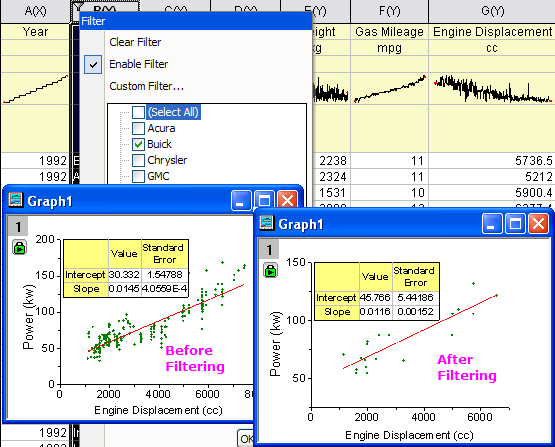
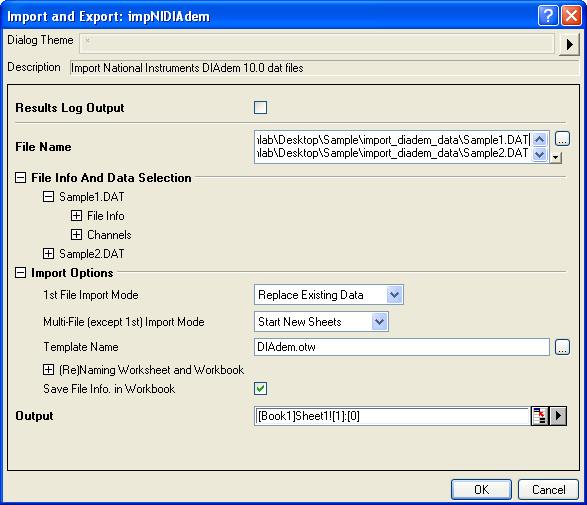
Origin is a data analysis and graphing software, developed for scientists, engineers and measurement engineers, to make the analysis process of large quantities of data accumulating daily efficient and to gain results quickly. These results can be output in informative, publication-quality graphs and reports. For beginners, Origin provides an intuitive user interface including worksheets – familiar from other spreadsheets – as well as analysis and graph templates. For advanced users, Origin allows the import from almost any data source as well as extensive customization and automation of Origin. This is supported by customized analysis and graphing tools, templates, individual reports, batch processing and, also, a technical scientific programming environment for C and Python.
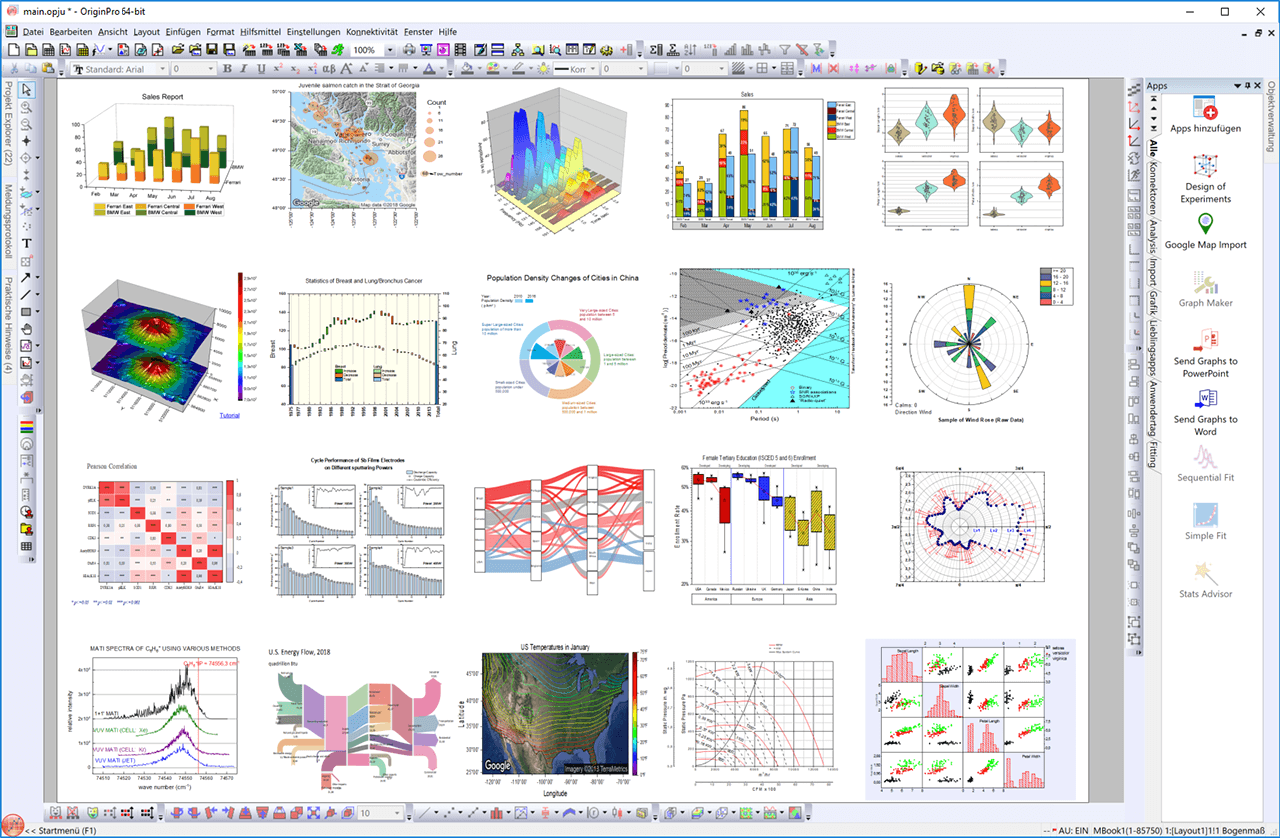
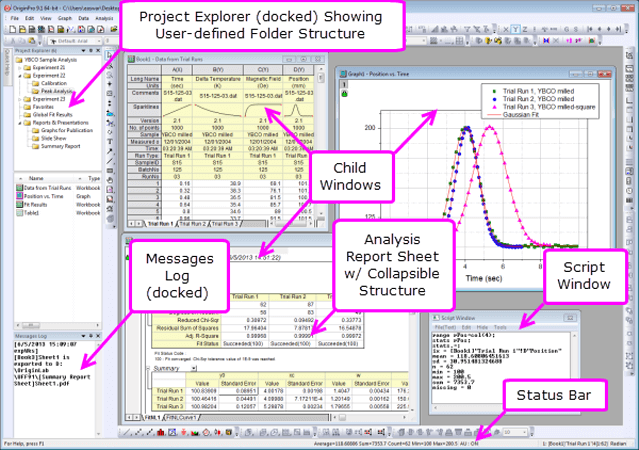
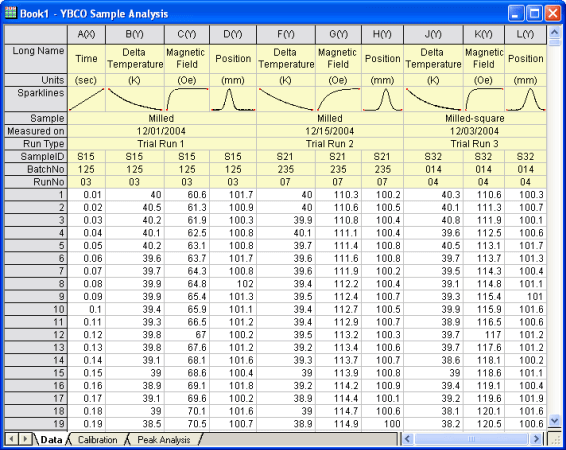
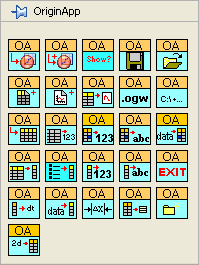
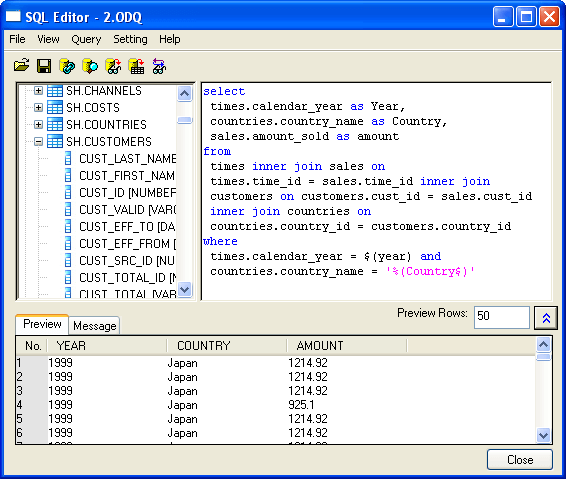
Gallery of the Origin User Interface:
Click to enlarge and browse
Unique Features of Origin/OriginPro
- over 170 graph templates (2D and 3D)
- automated data analysis with analysis templates and batch processing
- batch plotting, i.e. reproducing a graph using new data
- data filters and signal processing
- linear and nonlinear curve fitting, signal and peak analysis
- complex statistics, regression, Pivot tables
- flexible data import, database access
- unique apps concept, similar to apps installable on smartphones
- 3D surface editing: OpenGL-based 3D graphs
- PRO: 3D surface fitting and peak/baseline analysis
- PRO: image processing, Wavelets, short-time FFT
- workbooks containing multiple data sheets - familiar from other spreadsheets
- publishable graphs and reports within Orgin/OriginPro, including export option to Word, Excel, and Powerpoint
- automated reporting system to Word, Excel, and Powerpoint, as well as support of web reports (HTML dialog with JavaScript)
- direct MatLab and Mathematica compatibility
- integrated NAG Mark 26.1 Library, thus numerical high-precision computation
- Origin C (complete ANSI C), enabling the integration and use of C code
- Python integration, enabling the integration and use of Python code
- R-console and support of Rserve for exchanging data between Origin and R
- automation server for VB, C++, .net, C#, and LabView
OriginPro offers all features of Origin plus advanced analysis tools for statistics, including nonparametric tests and ANOVA with repeated measurements, image processing, 3D surface fitting, and peak analysis.