
")


Datenauswertungen mit Origin verbessern das Verständnis der chronisch obstruktiven Lungenerkrankung
M.D., Ph.D. Bengt Kayser, McGill University Montreal
McGill University researchers have gained a better understanding of chronic obstructive lung disease through experiments that induce pulmonary hyperinflation in healthy subjects. The experiments showed that the discomfort experienced by sufferers of this disease is largely due to their inability to empty the lungs during expiration which increases the effort required for inspiration. The next step is attempting to develop new breathing techniques and exercises to strengthen the upper body in an effort to reduce breathing difficulties. A key to the success of these experiments was the use of a new Windows-based data acquisition and analysis package which made it possible for researchers to immediately begin viewing, plotting and analyzing data while the experiment was still being run. A key obstacle which had to be overcome in these experiments was that actual chronic obstructive lung disease patients could not be used as subjects because of the risk to their health. Instead, a starling resistor was used on the expiratory leg of the respiratory circuit to induce pulmonary hyperinflation in normal healthy subjects. The starling resistor was set to limit flow to a maximum of one liter per second. When the subject reached a certain level of exertion, the flow limitation forced them to utilize higher lung volumes. This effect is comparable to what would happen in a person suffering from chronic obstructive pulmonary disease or asthma when ventilatory demand increases, for example, during exercise.
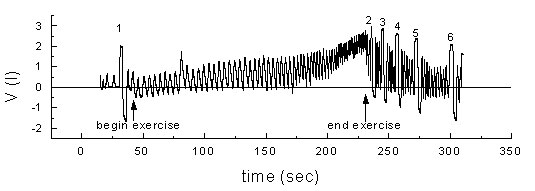
The experiments demonstrated that discomfort experienced by lung disease sufferers is closely related to an increase in end-expiratory lung volume. The volume increase is caused by their inability to empty their lungs because of the limitation on expiratory flow. This was demonstrated by the fact that the exercise limitations experienced by the healthy subjects were linearly related to the amplitude of the pressure difference from expiration to inspiration. Some progress was also made in training the healthy subjects in alternate breathing techniques that allowed them to increase their exercise performance under the flow limitations set by the starling resistor. Extensive instrumentation was required to monitor the breathing patterns of the subjects of these experiments. A pneumotachograph was attached to a mouthpiece to measure the air flow. This device measures the pressure drop over a honeycomb grid, making it possible to calculate the airflow in and out of the lungs. A pressure transducer was also attached to the mouthpiece. The subjects were also asked to swallow two small latex balloons to measure pressure in different areas of the respiratory tract. One balloon was oriented in the esophagus and the other in the stomach of the subject. Two pairs of magnetometers, one at the level of the sternum and the other at the level of the navel, were used to measure chest wall displacement. These measurements provide reference of differential respiratory muscle use. The concentration of CO2 in the exhaled air was measured by continuously drawing a small sample of gas and feeding it to an electronic composition analyzer. Finally, the amount of oxygen in the blood was measured through the infrared absorption method. An infrared sensor was applied to a finger or ear of the subject to measure the amount of light that was absorbed, making it possible to calculate the percentage of hemoglobin in the bloodstream that was saturated with oxygen.
McGill researchers wanted to perform these experiments in order to be able to monitor subjects under a wide range of exercise conditions. They wanted to be able to acquire and analyze data on a laptop computer so that they would not be restricted to exercises which could be performed in their laboratory. They obtained a National Instruments DAQ 700 card, one of the first analog-todigital converter cards made in the form of a Type 2 PC card that fits most laptop computers. This card was installed in an IBM Thinkpad Model 750 CS which is an 80486 system running at 33 MHz with 12 MB RAM. When this experiment first began, data acquisition was performed with MS-DOS-based data acquisition software.
The main problem with this software was that it did not contain data acquisition capabilities and generated data files in a proprietary binary format. This meant that each file had to be converted to the ASCII format before it could be imported into a separate data analysis package for analysis. This process, which took about an hour, could not even be started until all of the experimental data was acquired. One other problem with this package was that the file size that it could handle was limited meaning that it could not handle high sampling rates or long sampling periods.
Researchers examined another popular data acquisition and analysis system that supported the DAQ 700 card but found that the learning curve to master it was quite steep. Then, the McGill researchers heard about a software package that provides extensive acquisition and analysis capabilities combined in a single system and was only a fraction of the cost of the other program. This package, called Origin, offers real-time analysis and acquisition so that researchers can examine their data while the experiments are being run and perform analysis and plotting without exporting or importing data or even loading up another software package.
McGill researchers quickly developed a data acquisition system in which the seven channels of data mentioned above scroll across the screen and are written into a worksheet. Having all the signals scrolling quickly alerts the researchers if a wire comes loose or some other problem occurs, so that they can stop the experiment and fix the problem. McGill researchers also wrote several simple scripts that perform real time analysis tasks that are impossible with a multiple software solution. For example, McGill researchers wrote a two-line script that calculates a moving average of data at 10 second intervals and displays it on the screen. The ability to acquire and analyze data and generate graphics from within a single software package helped to researchers collect and analyze the data in far less time than would have been required using the previous software.